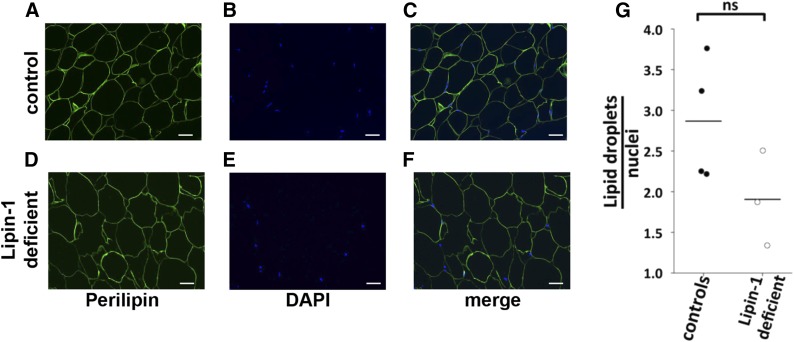
Fig. 2.
Histomorphometrical analysis of the adipose tissue in patients carrying biallelic LPIN1 inactivating mutations. Histological sections from subcutaneous adipose tissue biopsies derived from lipin-1-defective patients and controls were immunostained with an anti-perilipin antibody; the nuclei were counterstained with DAPI. The sections were subjected to immunoflourescence microscopy. Representative immunofluorescent image for a control individual (A–C) and for a lipin-1-defective patient (D–F) are shown. Perilipin cellular distribution and relative abundance did not show significant difference in the adipose tissue from lipin-1-deficient individuals when compared with that of normal controls. Anti-perilipin antibody, green; DAPI staining of the nuclei, blue; scale bars = 25 μm. The experiment was repeated using biopsies from three independent lipin-1 defective patients and four control individuals and gave similar results. G: Ratio of the total number of adipocyes to total number of cells (estimated by nuclei staining). For each biopsy, the number of perilipin-positive adipocytes and DAPI-positive nuclei was counted in five random microscopic fields; the dots indicate the average ratio for each biopsy. Bars represent the mean from four independent control individuals and three independent lipin-1-defective patients. Student’s t-test and the Mann-Whitney U test were used for controls versus lipin-1-deficient sample comparison. ns, not significant.

