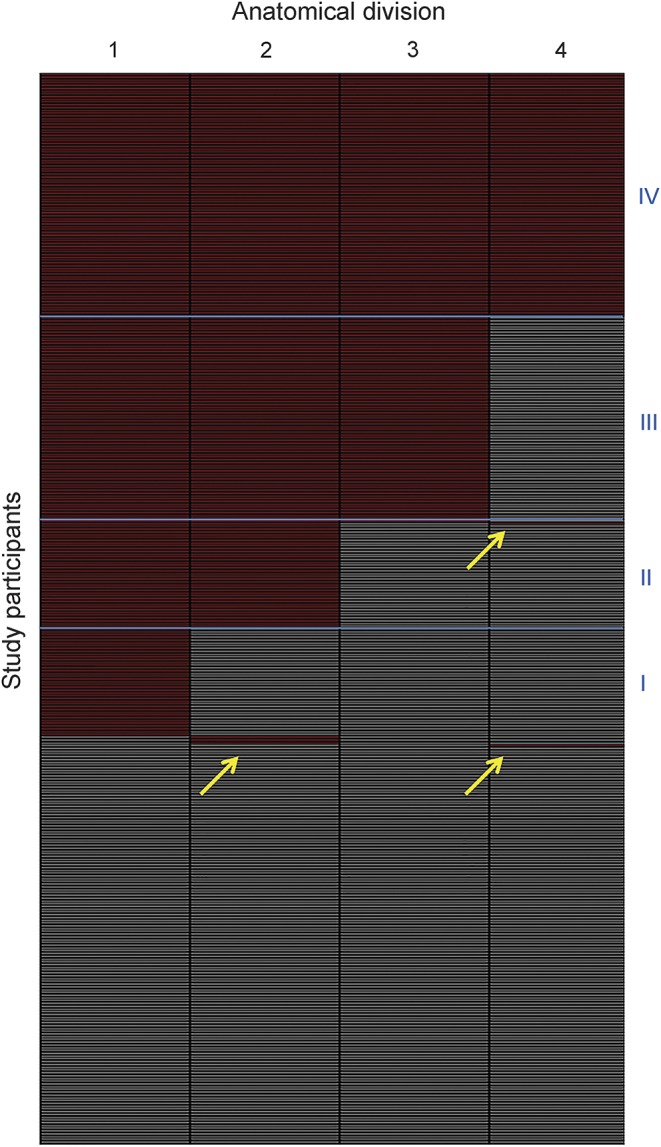
Figure 2. Staging of individual amyloid burden.

Each row of the matrix corresponds to a study participant and each column to one of the 4 anatomic divisions (1–4). Absence or presence of amyloid is denoted by gray and red, respectively. Amyloid deposition in the 4 anatomic divisions shows a consistent hierarchical nesting across participants, allowing us to stage 98% of the participants with detectable regional amyloid deposits into one of the 4 amyloid stages predicted by the regional progression model (blue boxes, I–IV). Only 8 participants showed distribution profiles that did not conform to the model (yellow arrows; 2 individuals [1 cognitively normal (CN), 1 Alzheimer disease] with deposition profiles of 1-1-0-1; 5 individuals [2 CN, 3 mild cognitive impairment (MCI)] with 0-1-0-0; and 1 individual [MCI] with 0-0-0-1).
