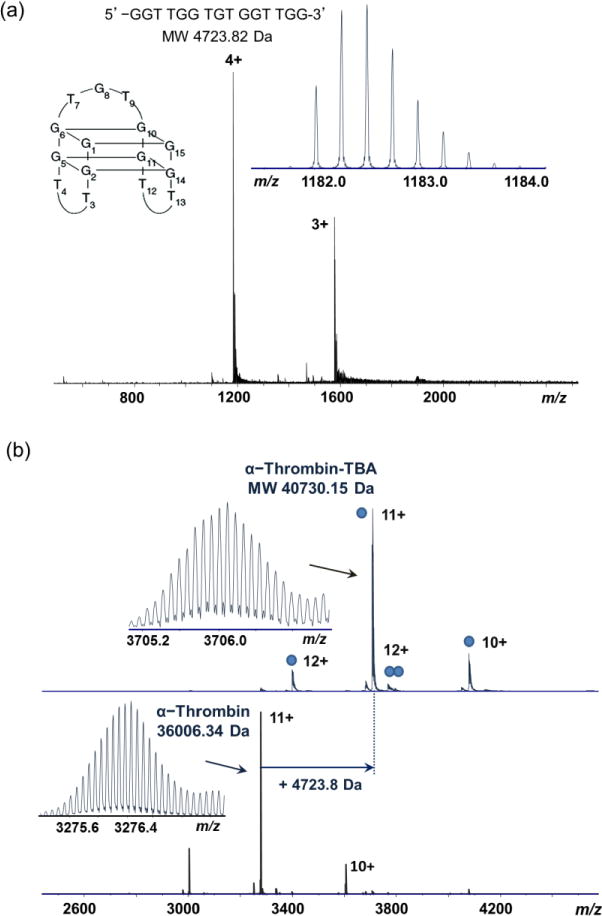
Figure 2.

High resolution native MS of human α-thrombin-TBA complex. (a) Positive ion mass spectrum of TBA; (b) mass spectra of thrombin-TBA complex and thrombin, acquired from solution containing 200 mM NH4OAc. The mass difference shows the incorporation of one TBA in the complex. The mass values are annotated as monoisotopic mass. The accurate mass measurements are shown for the 11+ ions (inset). The filled blue circles indicate the number of TBAs in each complex.
