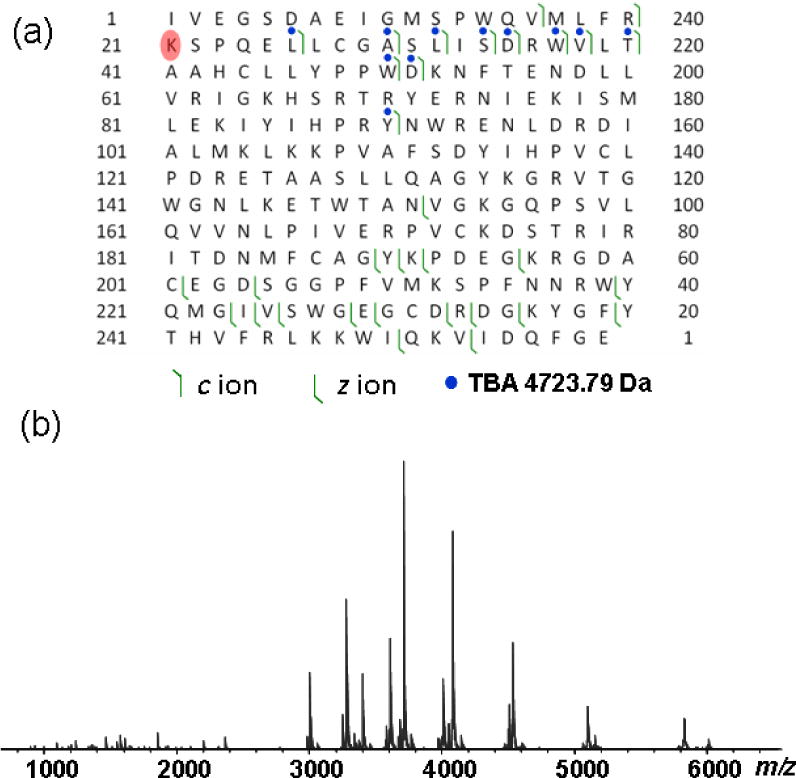
Figure 4.

ECD fragmentation of the human α-thrombin-TBA complex. (a) Product ion map of the thrombin-TBA complex. Only the heavy chain is shown. Blue circles indicate the mass increase of 4723.8 Da, corresponding to the mass of intact TBA. The highlighted residue (Lys21) in red indicates the interaction site; (b) ECD mass spectrum of the thrombin-TBA complex.
