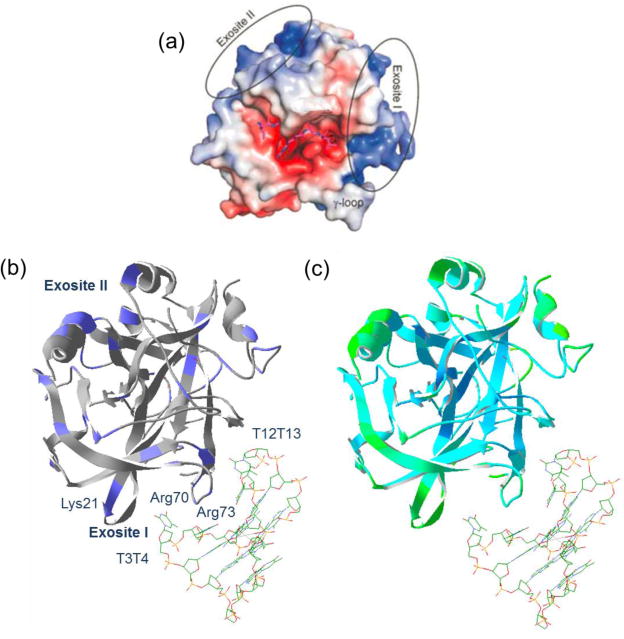
Figure 5.

Structures of human thrombin and thrombin-TBA complex. (a) The surface structure representation of the electrostatic properties of human α-thrombin (PDB 1TB6). The blue color shows the positively charged surface areas and the red color indicates the negatively charged surface areas. The positions of the two anion binding exosites are highlighted; (b) the structure of the thrombin-TBA complex (PDB 4DII). The thrombin structure is shown in ribbons, and the TBA molecule is shown in the stick structure. Positively charged residues are colored blue on the structure. The identified and other potential binding sites are labeled; (c) the structure of thrombin-TBA complex (PDB 4DII) with the B-factor highlighted. The green color represents regions with high flexibility; the cyan color represents regions with low flexibility.
