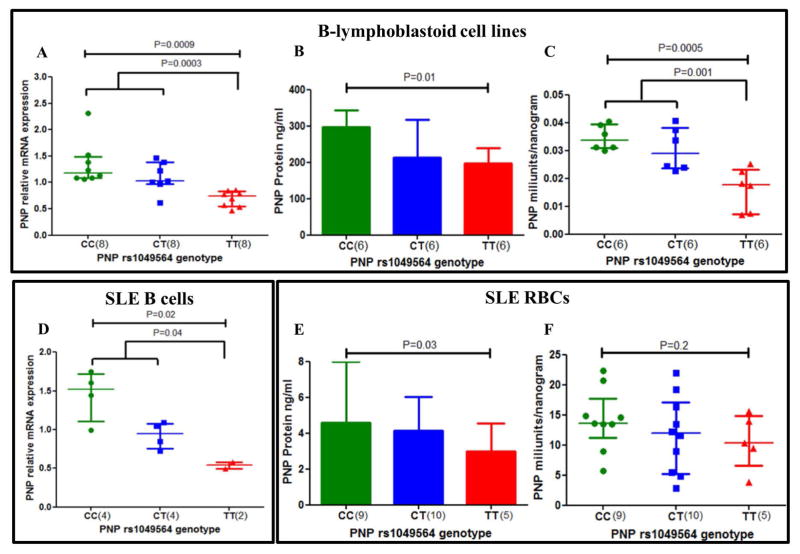
Figure 2. The PNP rs1049564 variant has lower enzyme activity and decreased mRNA expression levels in B lymphoblastoid cells and primary cells from SLE patients.
PNP mRNA levels are shown for (2A) B cell lines and for (2D) primary B cells from SLE patients of different genotypes. PNP protein levels are shown for (2B) B cell lines and for (2E) RBC lysates from SLE patients of different genotypes. PNP enzyme activity is shown for (2C) B cell lines and for (2F) RBC lysates of SLE patients of different genotypes. Y axis shows the PNP enzyme activity per unit mass for the cells studied. Enzyme activity was determined by colorimetric assay. The median and interquartile ranges are shown for all scatter plots and box plots. Mann-Whitney U was used to test significant differences for mRNA and protein levels between genotype groups. Unpaired t-test was used to compare enzyme activity between genotypes. For B lymphoblastoid cell lines, n = 6 to 8 for each genotype studied as indicated. For primary B cell and RBC samples, n = 2 to 10 as indicated.

