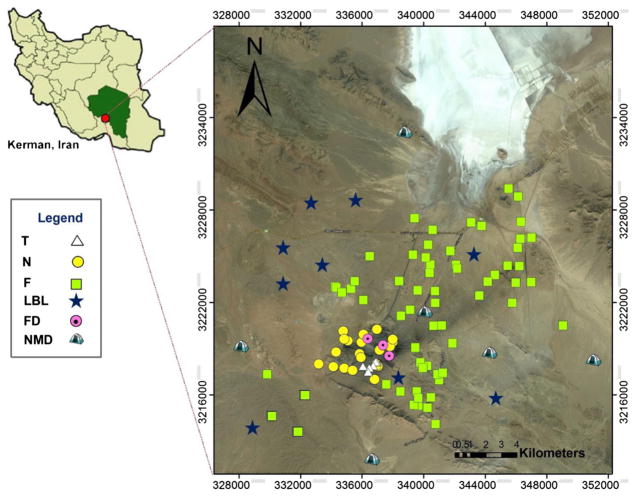
Fig. 1.
Map showing the study site location at Gol-E-Gohar iron ore mine. Yellow, white, green, and dark blue markers in the right image represent the locations where soil (N, F, LBL) and tailing (T) samples were collected. Purple markers indicate where fallout dust (FD) samples were collected. T tailings, N near, F far, LBL local baseline, FD fallout dust, NMD nomads

