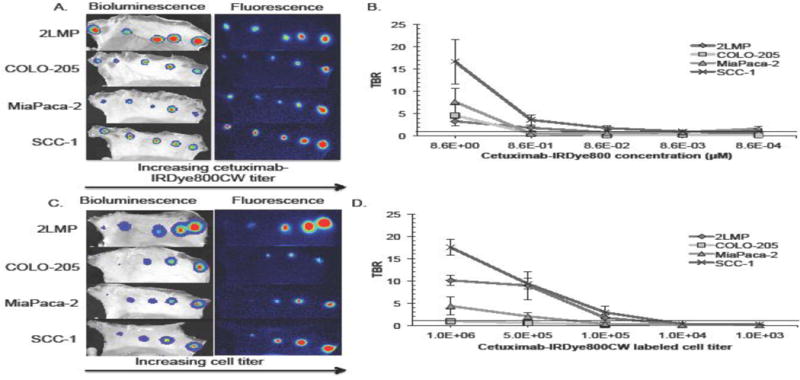
Figure 2.

Results from the experiment described in Figure 1A, performed to identify the lowest cetuximab-IRDye800CW dose that provides positive contrast. (A) Visual representation first of disease verification at all 5 implantation sites for all cell lines on bioluminescence imaging and then the respective fluorescence signals detected on fluorescence imaging. (B) Graphically displays the tumor-to-background mean fluorescence counts for each cell line at all 5 tested cetuximab-IRDye800CW concentrations. Results from the experiment used to identify the minimum amount of cells fluorescently detected using cetuximab-IRDye800CW as depicted in Figure 1B. (C) Representative bioluminescence and fluorescence acquisitions are shown. (D) Graphical representation of tumor-to-background mean fluorescence signal recorded on fluorescence imaging for each cell line at each labeled cell concentration. (B and D) Threshold lines drawn at TBR=1 represent the theoretical disease detection limit.
