
Figure 4.
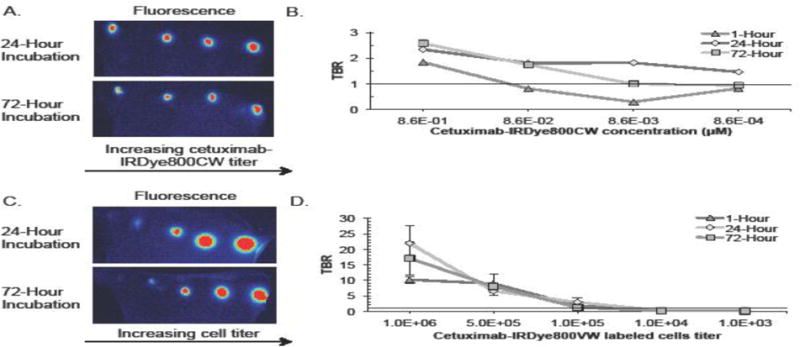
(A) Representative images of tittered cetuximab-IRDye800CW concentrations in tumors containing cells incubated at either 24 or 72-hours. (B) Tumor-to-background ratios of tumors following 1, 24, and 72-hour incubation times are shown for each concentration tested. (C) Representative images of tittered cetuximab-IRDye800CW (8.6×10⁻² μM) incubated cell numbers in tumors containing cells incubated at either 24 or 72-hours. (D) Tumor-to-background ratios of tumors following 1, 24, and 72-hour incubation times are shown for each cell number tested.