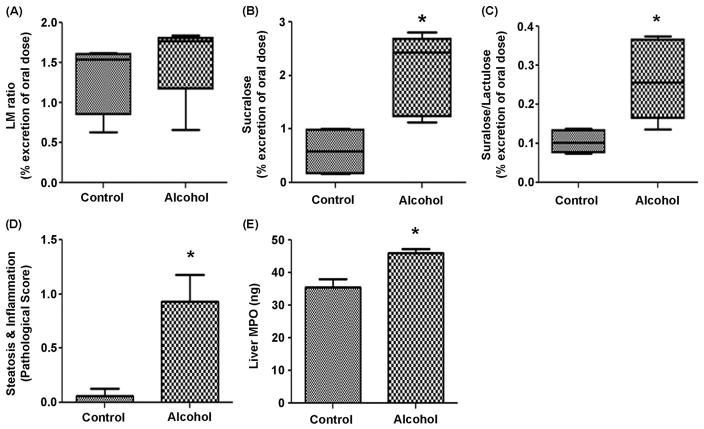
Figure 2. Alcohol-fed mice demonstrate intestinal hyperpermeability and liver pathology.
C57BL/6 mice were fed chow or chow + alcohol in water for a 2 week ramp period followed by 8 weeks of 15% alcohol. After week 7 of 15% alcohol, fasted mice were gavaged with a solution containing sucrose, mannitol, lactulose, and sucralose and placed in a metabolic chamber for 5h for urine collection. Urine was analyzed for sugar content by gas chromatography (Methods). Data are expressed as mean urinary % excretion of the original oral dose ± SEM (n = 4 mice/group). (A.) Lactulose/Mannitol (L/M) ratio; (B.) Sucralose; (C.) Sucralose/Lactulose ratio. p=0.11 for L/M ratio; *p<0.016 for sucralose; *p<0.032 for sucralose/lactulose ratio (t-tests). (D.) Liver samples were collected, formalin fixed, paraffin embedded, and slides stained with H&E for evaluation of combined steatosis and inflammation score (0–6) (n = 8 mice/group) (Methods). Data are means of this score ± SEM p*<.05 (Mann-Whitney). (E.) A portion of the liver was flash frozen and later analyzed for MPO by ELISA. Data are means ± SEM of ng MPO/gm liver tissue with *p<.05 (t test)(n = 4 mice/group).

