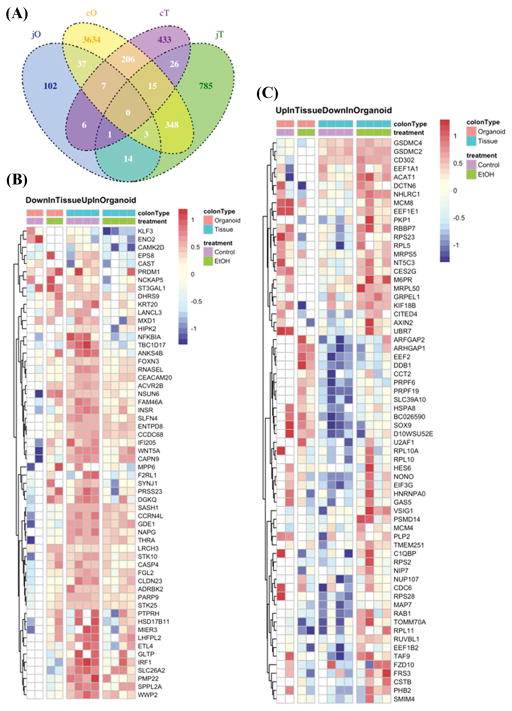
Figure 5. Venn diagram and additional heat maps for RNA-seq data.
(A.) A Venn diagram of RNA seq data for genes differentially expressed in each designated tissue with alcohol feeding (vs. control) was constructed as described in Methods. Groups are: jO (jejunum organoids); cO (colonic organoids); cT (colonic tissue); jT (jejunum tissue). Heat maps were also constructed from RNA seq data as described in Methods using the 206 alcohol feeding related genes found to overlap between cO and cT in the Venn diagram (5A) but without the genes already shown in heat maps Figs. 4Ea (43 genes) and 4Eb (33 genes) and thus depict 130 genes: (B.) Down in tissue (blue) Up in organoids (red); and (C.) Up in tissue (red) Down in organoids (blue).

