
Figure 1. Development of a Residue-Centric Presentation Score.
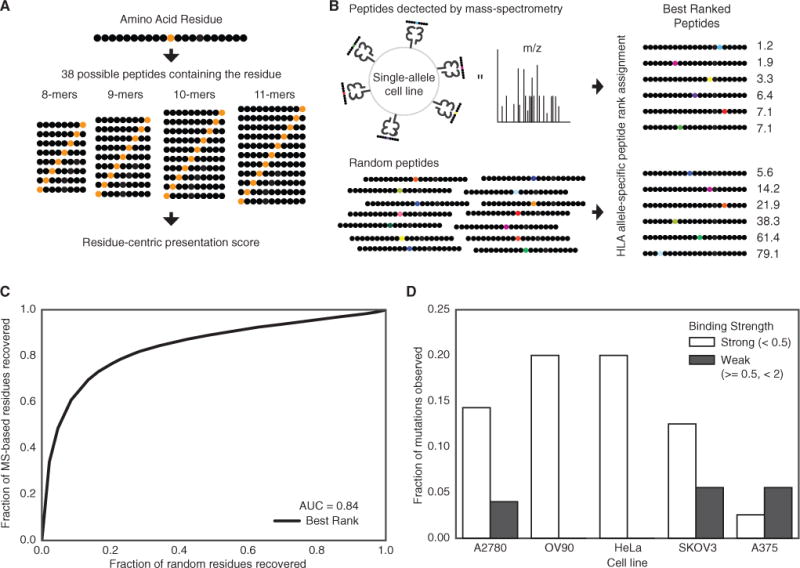
(A) A graphical representation of calculating the presentation score for a particular residue. Each residue can be presented in 38 different peptides of differing lengths between 8 and 11.
(B) Single-allele MS data from Abelin et al. (2017) was compared to a random background of peptides to determine the best residue-centric score for quantifying of extracellular presentation (best rank score shown).
(C) A ROC curve showing the accuracy of the best rank residue presentation score for classifying the extracellular presentation of a residue by an MHC allele. The aggregated presentation scores for MS data from 16 different alleles was compared to a random set of residues with the same 16 alleles.
(D) The fraction of native residues found for the list of mutations identified in five different cancer cell lines for strong (rank <0.5) and weak (0.5 % ≤ rank <2) binders. The mutated version of the residue is assumed to be presented if the mutation does not disrupt the binding motif.
See also Figure S1 and Table S1.