
Figure 2. Development of a Patient Specific Residue-Centric Score.
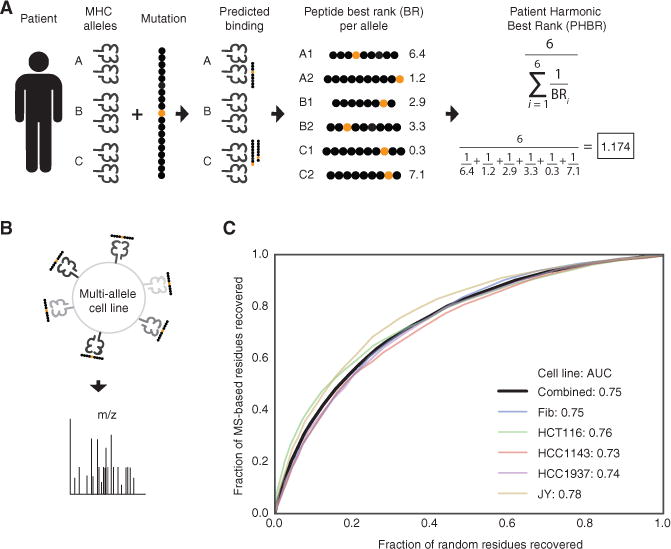
(A) A graphical representation of calculating the patient presentation score for a particular residue. Each patient has six MHC alleles. The Patient Harmonic-mean Best Rank (PHBR) presentation score is the harmonic mean of the best rank score of a residue across a patient’s six alleles.
(B) An experimental schematic of the MS data collection used in the score validation.
(C) A ROC curve showing the accuracy of the PHBR for classifying the extracellular presentation of a residue by a patient’s six MHC alleles for 5 different cell lines (colors) and for peptides from all cell lines combined (black). The aggregated PHBR presentation scores for 5 cell lines expressing 6 MHC alleles was compared to a random set of residues for the same MHC alleles.
See also Figure S2 and Table S2.