
Figure 4. PHBR Predictive Power for Mutation Probability.
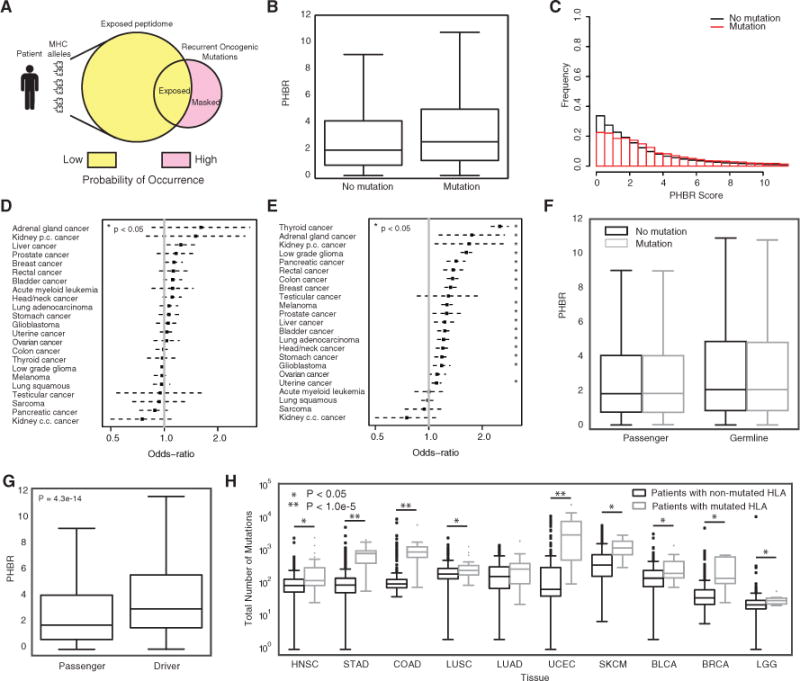
(A) A schematic showing the fundamental hypothesis by which an individual’s MHC allele-specific coverage of the oncogenic mutational space influences the probability of occurrence of oncogenic mutations.
(B) A boxplot denoting the difference in PHBR scores for the 1,018 oncogenic mutations and 9,176 patients split by mutation occurrence. Error bars denote the 1.5 IQR range.
(C) Histograms of PHBR scores associated with the presence or absence of mutations.
(D and E) The ORs (black boxes) and 95% CIs associated with a 1-unit increase in PHBR score for different cancer types using (D) the within-mutation model and (E) the within-patient model.
(F) Boxplots for the PHBR scores grouped according to presence or absence for passenger mutations and germline variants. Error bars denote the 1.5 IQR range.
(G) A boxplot denoting the difference in patient-specific presentation scores for acquired mutations when divided into driver mutations and passenger mutations. Error bars denote the 1.5 IQR range.
(H) Boxplots showing the total number of mutations acquired for patients who acquired a mutation in one of their HLA genes versus those that did not. Patients are divided by tumor type and only the tumor types with at least five HLA-mutated patients are shown. Error bars denote the 1.5 IQR range.
See also Figure S4, Table S5, and Table S6.