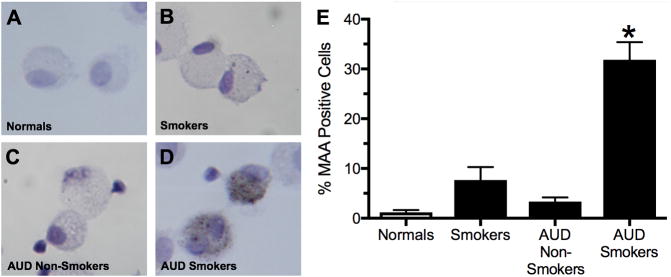
Figure 1. Immunohistochemical staining for MAA adducted protein.
BAL cells (mostly macrophages) from non-AUD/non-cigarette smokers (−AUD/−Smoker; panel A), AUD subjects who did not smoke cigarettes (AUD/−Smoker; panel B), cigarette smokers without AUDs (−AUD/+Smoker; panel C) and AUD subjects who smoked cigarettes (+AUD/+Smoker; panel D) stained for MAA adducted protein. Cells stained positive for MAA adduct were counted under microscope and calculated as % of MAA positive cells in the total number of cells counted for each group (D). Values are presented as the mean ± SEM and analyzed by One-Way ANOVA with Tukey’s post hoc multiple comparisons. Subject numbers were as follows: normal nonsmokers (22), smokers (22), AUD nonsmokers (20), and AUD smokers (45). *P ≤ 0.05 vs. other groups.

