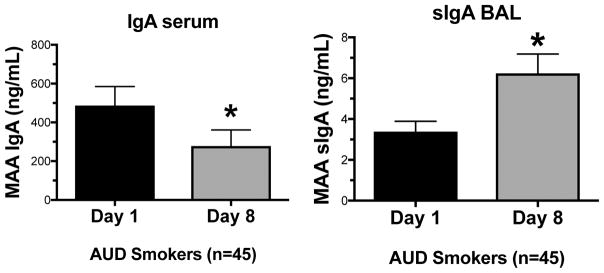
Figure 3. IgA antibodies level after 1 week of alcohol cessation.
Serum and BAL samples from AUD smokers were measured for IgA and sIgA levels, respectively, at day 1 and 1 wk following alcohol cessation using ELISA. Values are presented as the mean ± SEM and analyzed by Student’s t-test. Subject numbers were as follows: AUD smokers (45). *P ≤ 0.05.

