
Figure 3.
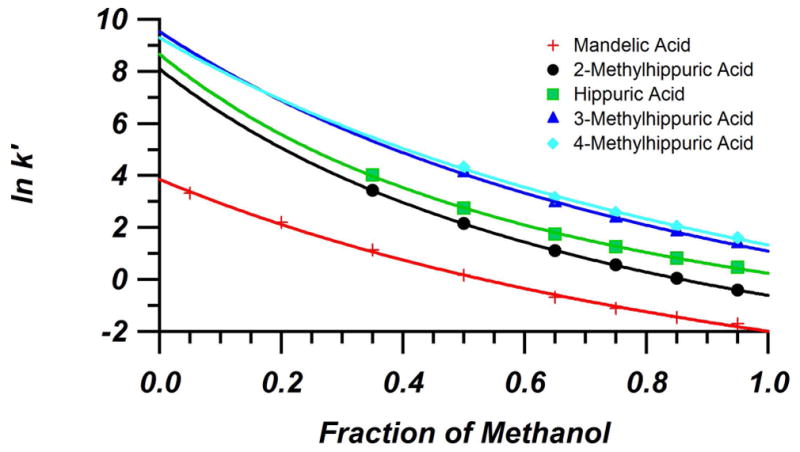
Plot of natural log of retention factors of the model metabolites as a function of methanol volume fraction in the mobile phase on the Hypercarb column (4.6 mm × 100 mm, 3 μm). Measurements made in water/MeOH + 0.1% FA mobile phases at 30 °C. Experimental data fit with Equation 2.