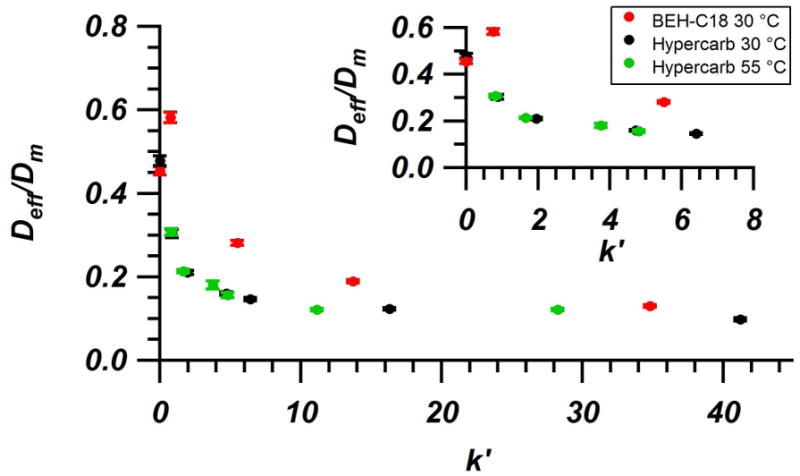
Figure 5.

Comparison of Deff/Dm at 30 °C for BEH-C18 (red), Hypercarb at 30 °C (black), and Hypercarb at 55 °C (green) as a function of analyte retention factor. The choice of analyte and mobile phase composition were varied in order to cover a wide range of retention factors for each column. Inset zooms on the region of moderate to low retention where curvature occurs. Error bars are shown for each data point. In-depth discussion of error calculation can be found in the Supplementary Material.
