Figure 2.
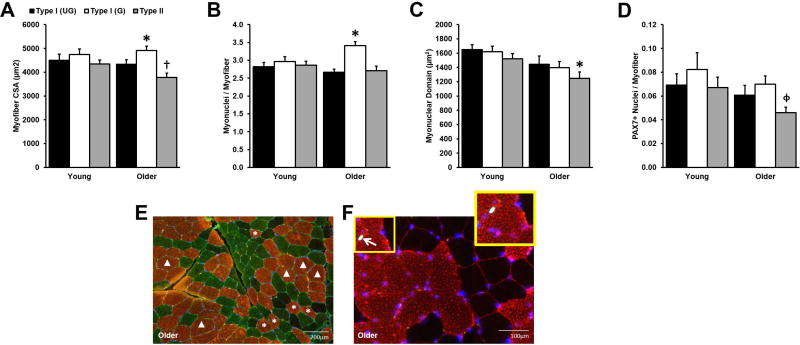
Cross-sectional area (CSA) and myonuclear number among grouped (G) and ungrouped (UG) myosin heavy chain (MHC) type I myofibers. No differences between G and UG MHC I myofibers in Young. Older G myofibers were larger (A) and had more myonuclei (B) than UG. No differences in myonuclear domain (C) or PAX7+ satellite cell (SC) number (D) between G and UG myofibers. Type II myonuclear domain (C) was lower in Older vs. Young as expected with age-related type II atrophy and, in Older, more SCs surrounded G MHC I myofibers than type II (D). (E) Representative immunohistochemical image displays CSA differences in G (Δ) vs. UG (*) (MHC I, copper; MHC IIa, green; MHC IIx, black; laminin, green; myonuclei, blue). (F) Representative immunohistochemical image displays myonuclei (blue), SC (arrow), MHC I myofibers (red), and laminin (red). Sample sizes: A, Older: n = 64; Young: n = 20; B/C, Older: n = 16; Young: n = 16; D, Older: n = 16; Young: n = 14. *Different from within subjects UG, p < 0.05. †Different from Young type II, p < 0.05. ϕDifferent from within subjects G, p < 0.05. Values are means + SE.

