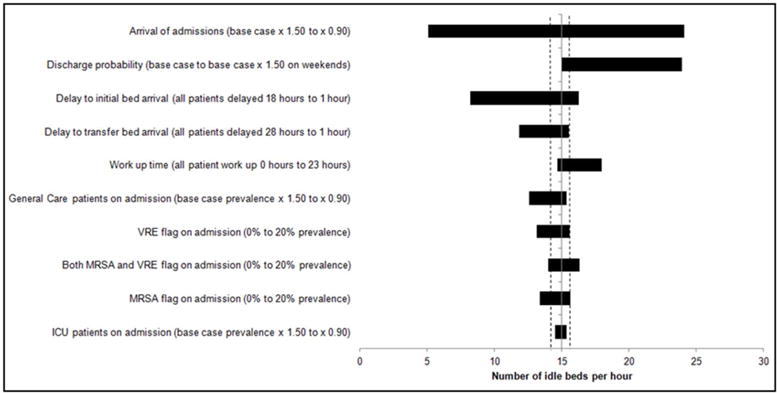
Figure 9.

Results of one way sensitivity analysis around total idle beds. Shown are the effects of altering various input parameters on the number of idle beds per hour model output. The solid vertical line indicates the mean base case value (15.1 idle beds) across ten 1-year runs. On either side of this line are two dotted lines indicating the range across the ten 1-year base case runs. Each horizontal bar represents a single input parameter being altered, with the length of each bar representing the range of idle beds over the specified values for each input parameter modified.
