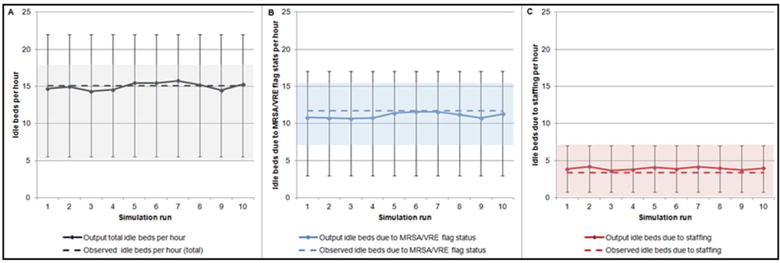
Figure 8A.

Idle beds. The observed mean number of total idle beds (15.1), idle beds due to MRSA/VRE flag status (11.7), and idle beds due to staffing (3.4) is compared to the mean number of model output total idle beds, idle beds due to MRSA/VRE flag status, and idle beds due to staffing across ten individual simulation runs in panels A, B, and C, respectively.
