
Figure 8B.
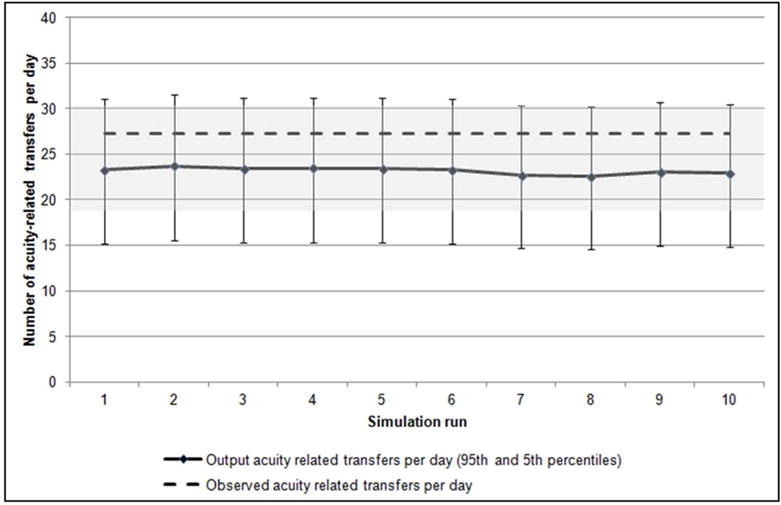
Acuity-related transfers per day. The observed mean number of acuity-related transfers per day (27.2) is compared to the mean number of acuity-related transfers per day output across ten individual simulation runs, along with markers showing the 90% coverage interval fit with a Poisson distribution within each run. The same 90% coverage interval (18.4–35.6) around the observed mean acuity-related transfers is shaded. The coefficient of variation (standard deviation standardized to its own mean) across the ten simulation runs was 1.6%.