
Figure 1. Chemical shift imaging of GSH in the brains of patients with three subtypes of MS.
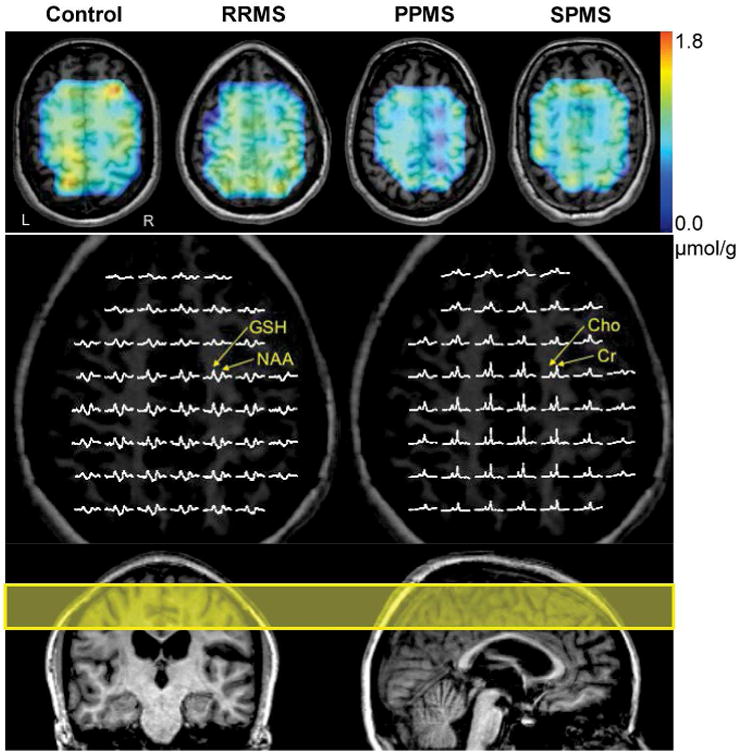
GSH concentration maps of a healthy control subject and patients with three subtypes of MS (RRMS, PPMS, and SPMS) are overlaid on T1-weighted MR images (top row). Low-resolution GSH concentration maps were resampled to match high-resolution anatomical images. The color bar (top right) indicates GSH concentration ranges from 0 to 1.8 μmol/g. Voxels with poor spectral quality and significant spectral fitting errors were excluded from the maps. Partial views of the in vivo GSH CSI (middle left) show clear detection of GSH signals throughout the CSI slice. The GSH CSI spectra (middle left) and the simultaneously acquired creatine (Cr) and choline (Cho) CSI spectra (middle right) are from the identical patient with RRMS shown in the color GSH concentration map (top row). Nominal voxel size for each CSI spectrum was 1.25 × 1.25 × 3 cm3 after 2× zero padding. Displayed spectral ranges of GSH and creatine/choline spectra are from 3.4 ppm to 2.2 ppm and from 3.6 ppm to 2.6 ppm, respectively. NAA: N-acetyl-aspartate. The yellow rectangle overlaid on sagittal and coronal MR images (bottom) indicates a 3-cm thick slice that was selected for GSH chemical shift imaging.