Abstract
Purpose
To evaluate biexponential T2 relaxation mapping of human knee cartilage in-vivo in clinically feasible scan times.
Materials and Methods
T2 weighted MR images were acquired from eight healthy volunteers using a standard 3T clinical scanner. A 3D Turbo-Flash sequence was modified to enable T2 weighted imaging with different echo times. Series of T2-weighted images were fitted using mono- and biexponential models with two- and four- parametric non-linear approaches, respectively.
Results
Biexponential relaxation of T2 was detected in the knee cartilage in five regions of interest on all eight healthy volunteers. Short/long relaxation components of T2 were estimated to be 8.27 ± 0.68ms/45.35 ± 3.79ms with corresponding fractions of 41.3 ± 1.1%/58.6 ± 4.6% respectively. The monoexponential relaxation of T2 was measured to be 26.9 ± 2.27ms. The experiments showed good repeatability with CVrms < 18% in all regions. The only difference in gender was observed in medial-tibial cartilage where the biexponential T2 in female volunteers was significantly higher compared to male volunteers (P = 0.014). Significant differences were observed in T2 relaxation between different regions on interest.
Conclusion
Biexponential relaxation of T2 was observed in the human knee cartilage in-vivo. The short and long components are thought to be related to the tightly bound and loosely bound macromolecular water compartments. These preliminary results of biexponential T2 analysis could potentially be used to increase the specificity for detection of early osteoarthritis by measuring different water compartments and their fractions.
Keywords: T2 relaxation, biexponential fitting, articular cartilage
INTRODUCTION
Osteoarthritis (OA) is a degenerative joint disease which causes changes in biochemical, morphological, functional and structural properties of cartilage and is mainly defined by the progressive loss of hyaline articular cartilage (1). Several imaging modalities such as radiography, radionuclide imaging, computed tomography (CT), ultrasound, and magnetic resonance imaging (MRI) have been used to diagnose OA (2,3). However, none of these clinical standard techniques are sensitive enough to detect early stage OA (4).
At the early stage of OA, the structure of collagen fibers starts to change. The loss of proteoglycans (PG) leads to an increase in water content in cartilage (5). Different water compartments in articular cartilage lead to different T2 relaxation components. Additionally, T2 is sensitive to collagen fibril orientation and anisotropy (6,7). As a result of the change in the biochemistry of cartilage and increase in water content due to OA, elevated T2 relaxation times is expected (4,5,8–12). The existing T2 mapping techniques include fast spin-echo (FSE) (9), multiple two-dimensional (2D) spin-echo (SE) acquisitions at different echo times (TEs) (13), and double echo steady state (DESS) acquisition methods (14,15).
Since different components in cartilage such as collagen, PG macromolecules, fragmented PG molecules, water molecules trapped within collagen fibrils, and free water molecules have different T2 relaxation times a biexponential model may provide more information on different water compartments than a monoexponential model. In most of the previous in-vivo studies (4,5,16), T2 was described by a monoexponential decay model, which shows the mean of relaxation time from all of the water compartments.
Liu et al. (17–19) measured two components of T2 relaxation in the human knee joint using the multicomponent driven equilibrium single shot observation of T1 and T2 (mcDESPOT) technique in which several balanced steady state free-precession (bSSFP) and spoiled gradient-echo (SPGR) scans were taken with different flip angles and radiofrequency phases. Then a two-pool model of longitudinal T1 and T2 relaxation were fit to the data (17,20–22). However, the short T2 component and its fraction suffer from partial volume effects (PVE)(19). Also, the accuracy of the estimation could be affected by the magnetization transfer (MT) effect (19,23).
The goal of this paper is to propose a method for estimating biexponential relaxation times of articular cartilage in the human knee joint using 3T MRI in clinically feasible scan times.
MATERIALS AND METHODS
Monte Carlo Simulations
The monoexponential T2 relaxation can be calculated by fitting the signal intensities of each pixel to:
| [1] |
In the same manner, the biexponential relaxation components can be estimated from:
| [2] |
Where T2s and T2l correspond to the short and long relaxation time components respectively. The weightings (fractions) of the short and long components are usually reported in percentage as as% = 100×As/(As + Al) and al% = 100×Al/(As + Al) respectively. s0 is the average noise level.
Monte Carlo simulations were performed for different T2 relaxation in the range of possible T2 values in the cartilage to determine a sufficient number of TEs for estimating four parameters in a biexponential model [2] considering the range. Under given signal to noise ratio (SNR), the smaller set of TEs is desired to minimize the total acquisition time.
To perform the Monte Carlo simulation, a set of signals were generated with a different set of TEs with known T2 relaxations time and their fractions (assuming As + Al = 1). Assuming the SNR of 1/σ (24) a random noise with normal distribution N(0, σ) was added to data. The relaxation components were estimated with a biexponential model using the noisy signals. The process was repeated for 500 independent noise trail and the mean absolute percentage error (MAPE) were calculated as:
| [3] |
Where Ym and Fm are the actual and estimated values respectively. n is the total number of noise trail (n = 500) in Monte Carlo simulation.
T2-weighted MRI Acquisition
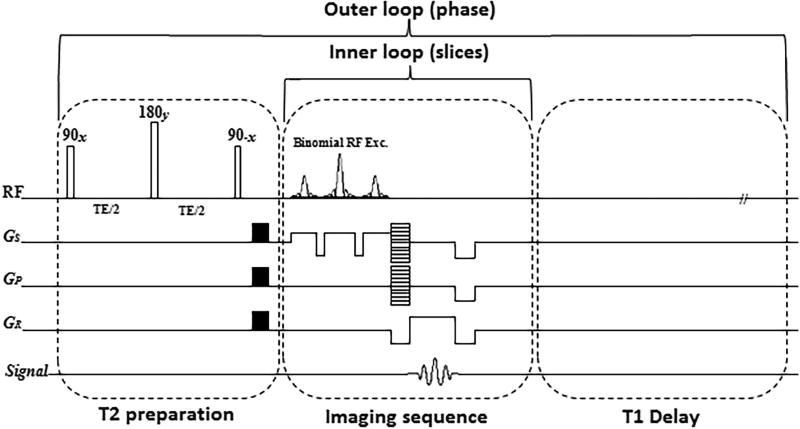
T2-weighted MR scans were acquired on a 3T whole-body clinical MRI scanner (Prisma, Siemens Healthcare, Erlangen, Germany) with a 15-channel Tx/Rx knee coil (QED, Cleveland OH). A 3D Cartesian turbo-Flash sequence was modified and T2 preparation module was added to the sequence for T2 imaging with variable echo times. The T2 imaging pulse sequence diagram is shown in FIG. 1.
FIG. 1.
The T2 mapping sequence timing diagram with preparation module, 3D turbo-Flash readout, and T1 recovery delay. One phase line from all slices was acquired after applying the T2 preparation module (inner loop) followed by a delay for T1 restoration. Then, the preparation module was applied again to acquire another phase line (outer loop).
For T2 relaxation mapping, a set of 3D scan was acquired with different TEs. The sequence acquisition parameters for all the scans were: TR/TE 1500ms/4ms, flip angle 8°, matrix size 256×128×64, slice thickness = 2mm, field of view (FOV) = 120mm× 120mm, and receiver bandwidth = 515 Hz/pixel. Binomial water excitation pulse and GRAPPA (25) parallel imaging method were used in readout section for fat suppression and decreasing the total acquisition time, respectively.
Ex-vivo Bovine Cartilage Study
Fresh bovine patellae cartilage specimens (n=3, age=~6 months old) were obtained from a slaughterhouse (Max Insel Cohen, Inc., Livingston, NJ) within 24 hours postmortem. The bovine cartilage specimens were equilibrated in phosphate-buffered saline (PBS) for one hour before the MRI study. After that, the specimen was covered with parafilm to avoid drying up during the scan. T2 weighted images were taken from three specimens at 15 different TEs including 0.5/2/4/6/7/8/10/12/15/20/25/35/45/55/65ms. The experiment was repeated with different acceleration factor of AF = 1–4 to examine the effect of reduced SNR due to parallel imaging on the estimated relaxation time. The total acquisition time for 3D data set with 15 TEs were 46, 27, 22, and 18 minutes for AF = 1(fully sampled) 2, 3, and 4 respectively.
In-vivo knee Study
The study was approved by the institutional review board (IRB) and all eight volunteers provided written informed consent before the scans. Eight healthy volunteers (n=4 females, and n=4 males) were recruited for this study with a mean age of 30 ± 4 years, mean weight of 63 ± 15kg, and mean height of 169 ± 12cm. Volunteer exclusion criteria were any knee pain or clinical symptoms, history of osteoarthritis or inflammatory arthritis, previous knee injury, and surgery on either knee
T2 weighted images were taken at 10 different TEs including 2/4/6/8/10/15/25/35/45/55ms. Using GRAPPA with AF = 3 the total acquisition time was decreased from 30 to 15 minutes.
The acquired T2-weighted scans were analyzed using a custom-written script in MATLAB (R2016a, The MathWorks Inc., USA). Mono- and biexponential T2 relaxation times were calculated pixel by pixel over five consecutive slices in five regions of interest (ROI): medial-tibia (MTC), medial-femoral (MFC), lateral-tibia (LTC), lateral-femoral (LFC), and Patellar (PC) cartilages.
In the final biexponential fitting map, the pixels that were not satisfied the following condition were excluded from the map (26).
| [4] |
The mean values of T2 were calculated across all volunteers in each ROI. Then, the mixed model with P = 0.05 as the threshold was used to assess the gender difference as well as the significance of the difference in T2 relaxation time components between different ROIs.
For repeatability investigation, the same scans were acquired from three volunteers, two weeks after their first scan. To evaluate the intra-subject repeatability (i.e. repeating the experiment on the same subject) the coefficient of variation (CV) was calculated for volunteer i as:
| [5] |
Where the Mi and SDi are the mean and standard deviation of the estimated relaxation times in two experiments.
The inter-subject repeatability (the repeatability across all volunteers) was reported as root mean sum square of the CVs of individual subject:
| [6] |
RESULTS
Monte Carlo Simulations
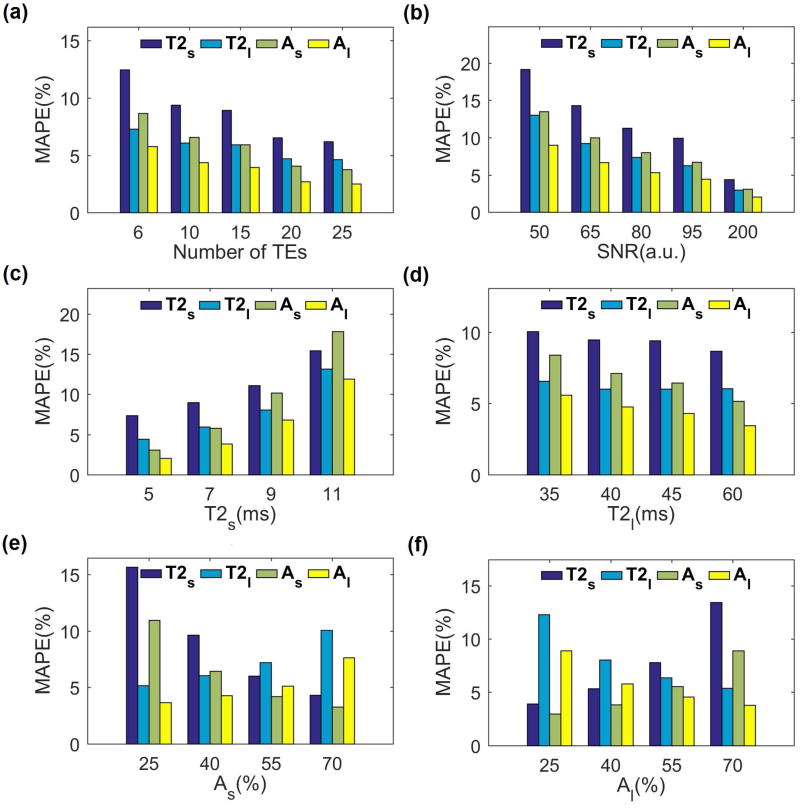
The results of Monte Carlo simulation are shown in FIG.2. The estimation error for short and long relaxation components and their fractions decreases by increasing the number of TEs (FIG. 2a) at the cost of longer total acquisition time. As shown in FIG.2a, the estimation error for 10 TE points is less than 10% for all parameters and the improvement with 15 TE points is not significant (less than 2%) considering the fact that the total acquisition time will increase by 50%. Hence, 10 TE points were selected for the rest of the simulations as well as in-vivo studies.
FIG. 2.
Monte Carlo simulations. (a) The biexponential relaxation estimation error decreases by increasing the number of TE points. (b) Higher SNR results in lower estimation error. (c) The estimation error of short relaxation component is higher for longer short component. (d) The estimation error of long component is higher for shorter long component. (e, f) The component with larger fraction (short in (e) and long in (f)) has been estimated more accurately than the component with smaller fraction.
As shown in FIG.2b, higher SNR leads to smaller error. The SNR of an in-vivo knee cartilage scan is expected to be around 60, resulting in an expected error of about 15% for the short component and 10% for the long component in the in-vivo study based on the simulation result. As the ranges of T2 are different in different tissues and subjects, the accuracy of estimation for different short and long T2 values are shown in FIG. 2c and FIG. 2d respectively. While the estimation is more accurate for lower values of the short T2 component, it is more accurate for the higher values of the long T2 components. The fractions also affect the estimation in a way that the component with the greater fraction has less estimation error that the components with the smaller fraction (FIG. 2e–f)
Ex-vivo bovine cartilage Study
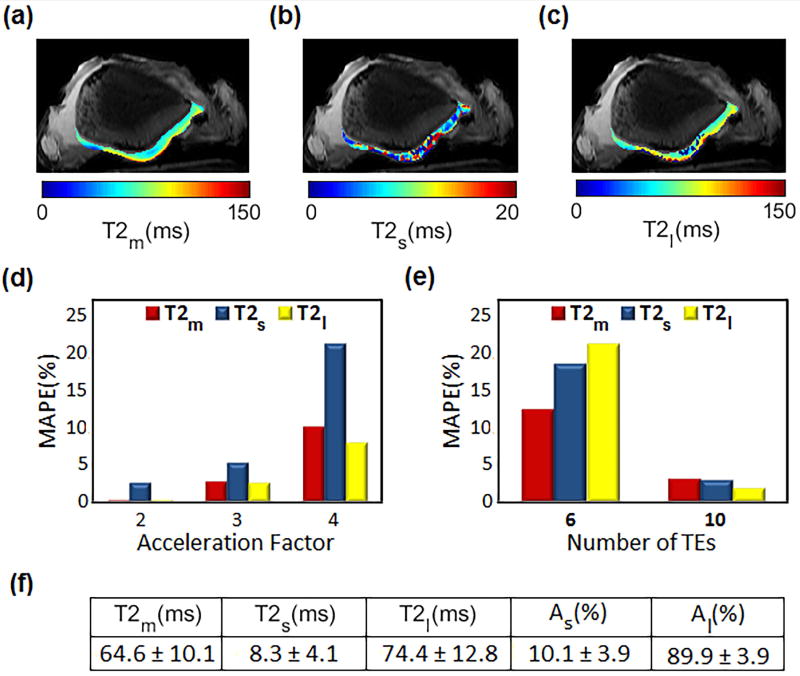
Mono, short and long T2 relaxation maps of a bovine patella from a representative slice are shown in FIG. 3a–c respectively. Considering the estimated T2 values from fully sampled data as a reference, FIG. 3d shows the estimation error for different GRAPPA acceleration factors (AF = 2–4). Using acceleration factor of 3 will decrease the total acquisition time from 32 to 15min while the estimated relaxations have less than 5% difference from the estimated values from fully sampled data. Hence; AF = 3 was selected for performing in-vivo experiments.
FIG. 3.
Ex-vivo study on bovine patella. Spatial T2 maps of estimated (a) mono (b) short and (c) long component (d) The estimation error between fully sampled data and scans with different acceleration factor. (e) Comparison of the estimated relaxations using 10 and 6 TEs with 15 TEs. The estimated relaxation components from 10 points have less than 5% difference from 15 TE points. (f) Estimated mean values for mono and biexponential components and their fractions.
The differences between the estimation using 15 TEs (as reference) with the estimation using 10 and 6 TEs are shown in FIG. 3e. The result shows less than 3% difference between the relaxation values estimated from 15 TE points and values estimated using 10 TE points, which is in agreement with the simulation study. Hence; 10 TE points was used in in-vivo knee studies as a good tradeoff between time and accuracy.
In-vivo knee articular cartilage study
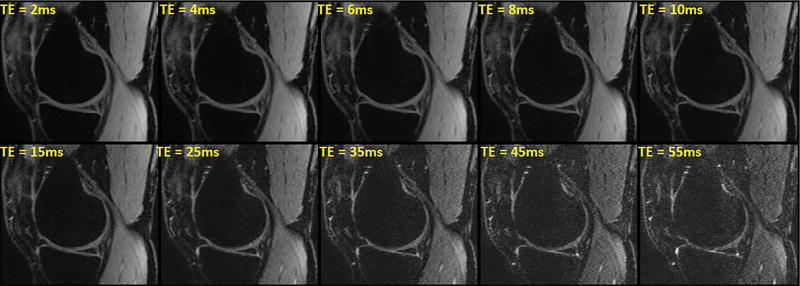
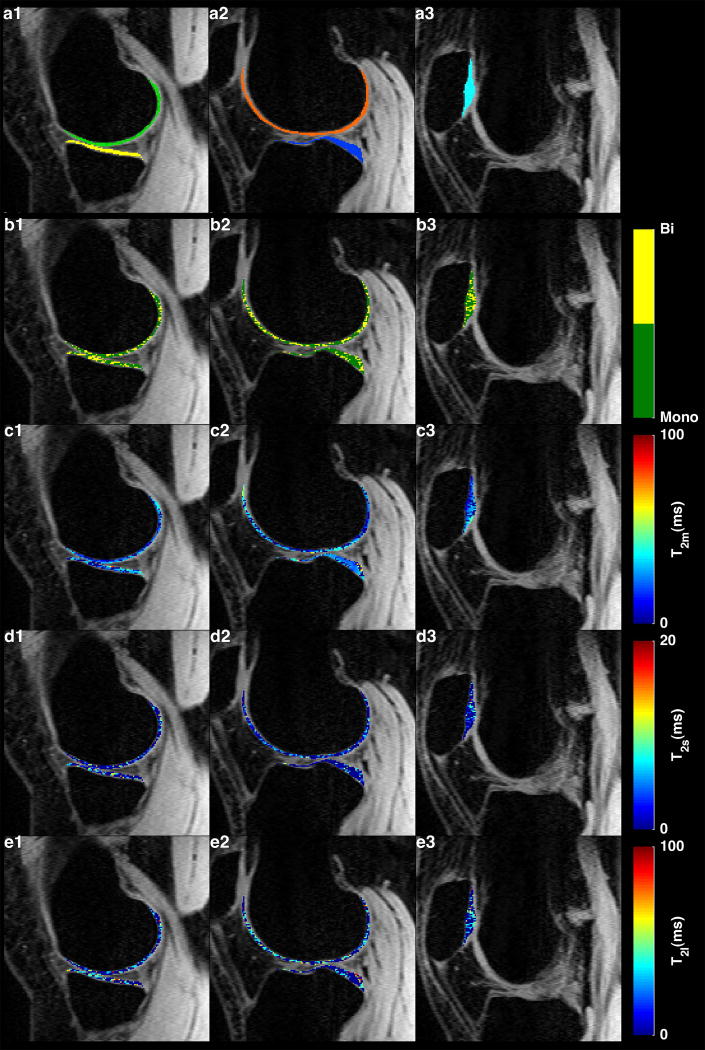
FIG. 4 shows the T2 signal decay with increasing TE in a representative medial slice. An example of T2 maps in medial, lateral and patellar cartilages are shown in FIG. 5. The binary maps in FIG. 5a1–3 show the distribution of pixels that meet the condition [4]. Approximately 46% of pixels in the ROIs had biexponential relaxation. The T2 descriptive statistics are summarized in Table 1. The short component has a lower fraction (41.3%) than the long component (T2: 58.7%).
FIG. 4.
Representative examples of T2-weighted images with different TE in a medial slice from one volunteer. The signal intensity decays by increasing TE.
FIG. 5.
(a1-d1) Five regions of interest for relaxation mapping: medial femoral (a1-green), medial tibial (a1-yellow), lateral femoral (a2-orange), lateral tibial (a2-yellow), and patellar (a3,cyan) cartilages. (b1-b3) binary maps show the distribution of the pixels with mono- and biexponential fitting in each ROI. (c1-c3)Representative examples of monoexponential, (d1-d3) biexponential short and (e1-e3) long T2 relaxation maps.
Table 1.
Descriptive statistics of mono- and biexponential relaxation and the ratio of biexponential pixels to total number of pixels calculated in five ROIs.
| ROI | Tmono (ms) | Tshort (ms) | Tlong (ms) | as (%) | al (%) | Ratio (%) | |
|---|---|---|---|---|---|---|---|
| MTC | Mean | 26.98 | 7.81 | 44.55 | 41.64 | 58.36 | 46 |
| SD | 2.84 | 1.23 | 3.07 | 1.23 | 3.07 | 16 | |
| R2 | 0.99 | 0.99 | 0.99 | -- | -- | -- | |
|
| |||||||
| MFC | Mean | 30.35 | 8.69 | 51.07 | 41.42 | 58.58 | 51 |
| SD | 3.08 | 0.99 | 4.09 | 0.99 | 4.09 | 8 | |
| R2 | 0.99 | 0.99 | 0.99 | -- | -- | -- | |
|
| |||||||
| LTC | Mean | 28.54 | 7.33 | 45.82 | 39.63 | 60.37 | 48 |
| SD | 3.09 | 1.08 | 4.05 | 1.08 | 4.05 | 11 | |
| R2 | 0.99 | 0.99 | 0.99 | -- | -- | -- | |
|
| |||||||
| LFC | Mean | 26.23 | 7.40 | 47.66 | 45.17 | 54.83 | 40 |
| SD | 4.00 | 0.74 | 5.31 | 0.74 | 5.31 | 8 | |
| R2 | 0.98 | 0.98 | 0.98 | -- | -- | -- | |
|
| |||||||
| PC | Mean | 24.58 | 6.59 | 40.71 | 38.78 | 61.22 | 45 |
| SD | 4.68 | 1.68 | 6.52 | 1.68 | 6.52 | 19 | |
| R2 | 0.99 | 0.99 | 0.99 | -- | -- | -- | |
|
| |||||||
| Global | Mean | 27.336 | 7.564 | 45.962 | 41.328 | 58.672 | 46 |
| SD | 3.538 | 1.144 | 4.608 | 1.144 | 4.608 | 12.4 | |
| R2 | 0.988 | 0.988 | 0.988 | -- | -- | -- | |
SD: Standard Deviation
R2 Adjusted R square
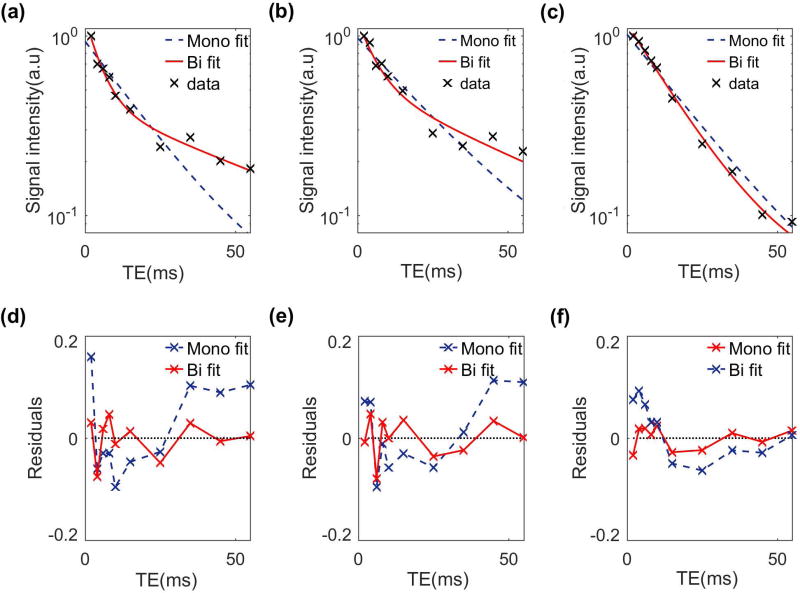
FIG. 6 shows the mono- and biexponential fit and their fit residuals in representative voxels. The deviation of data points from the straight line in logarithmic scale shows the existence of more than one exponential term. Moreover, the smaller fit residual in the biexponential model confirms that it better represents the relaxation behavior than the monoexponential model.
FIG. 6.
T2 Biexponential versus monoexponential fitting model and residuals in three representative slices from (a, d) lateral, (b, e) medial and (c, f) patellar cartilage.
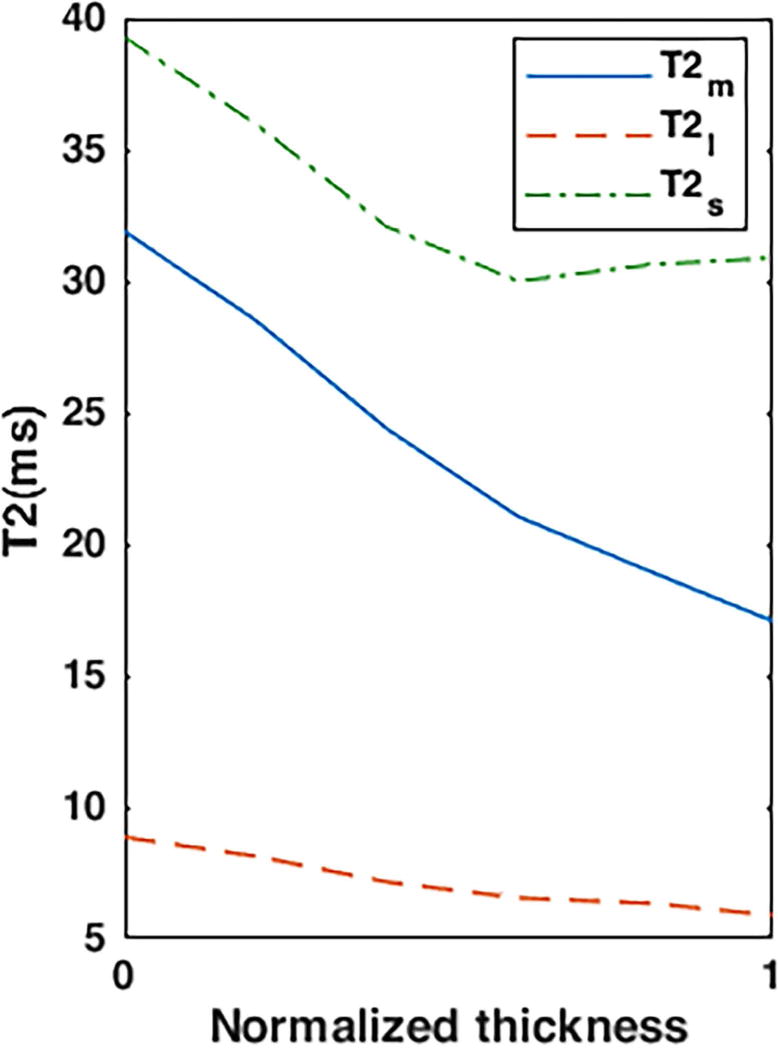
The biexponential T2 components variation was observed in different cartilage zones. As shown in FIG.7 mono- and biexponential T2 decrease from superficial zone to the subchondral bone.
FIG. 7.
Representative T2 relaxation profile in patellar cartilage from the superficial zone (0) to the subchondral bone (1)
Statistical Analysis
FIG. 8 shows the mean mono- and biexponential components of T2 among all volunteers as well as male and female volunteers. The mixed-model analysis for each component revealed:
A significantly higher (P = 0.014) biexponential T2 of MTC in female volunteers than in male volunteers.
Statistically significant difference in T2m between MTC and PC (P = 0.019)
Statistically significant difference in T2m between MTC and LTC (P = 0.025).
Statistically significant difference in T2l (P = 0.01) and T2s (P = 0.04) between MTC and PC.
FIG. 8.
Mean mono and biexponential T2 estimation of female (N=4), male (N=4), and all volunteers (N=8) in different ROIs.
Repeatability
Table 1 shows the intra-subject repeatability data. The CV is less than 10% for mono and biexponential relaxations. Higher CV was detected in the fractions.
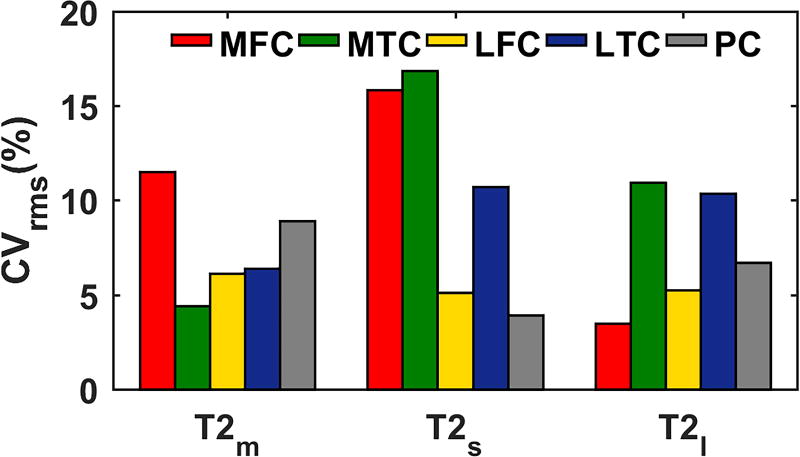
As shown in FIG. 9 long T2 relaxation has less variability (mean: 7% range: [3% – 11%]) than the short T2 relaxation (mean: 10% range: [4%-17%]), probably because the short component is more sensitive to change and also has larger potential differences between volunteers (27).
FIG. 9.
Inter-subject repeatability
The experiments showed good repeatability in the entire region (CV < 18%). No statistically significant difference was observed between CV in different ROIs
DISCUSSION
A 3T MRI technique for in-vivo, bicomponent T2 analysis of articular cartilage is presented in this paper. T2 relaxation time was measured in five ROIs in the articular cartilage of knee joints. The results suggest that a biexponential fit may better represent and differentiate the different relaxation times of different water compartments in the cartilage. It is expected the short component to be related to tightly-bound water in PG and collagen macromolecules while the long component corresponds to the water loosely bound to macromolecules.
Although the T2 relaxation range was comparable to the other studies (28–32), there were some differences that could be due to the partial volume effects (PVE), the number of echoes (TEs) acquired or the pulse sequence used in our study. The smaller slice thickness (2mm) in our study comparing to 3mm or 4mm of other studies (28–31), decreases the PVE. Moreover, 10 TE points were acquired in our study to model the T2 decay behavior which leads to more accurate estimation in comparison with other studies in which only used 4 or 5 data points or only two echoes in case of using double echo steady state (DESS) sequence (14,15,32). Furthermore, using different MR pulse sequences for T2 relaxation time measurements in articular cartilage can lead to different results. For example, in the Matzat study (33) a 35±22% difference was observed between the estimated T2 using 2D-FSE sequence and the estimated T2 from multi-echo SE (MESE) sequence.
The total acquisition time of our in-vivo study (14:45min) is also close the scan time of other studies (33) using 3D-MAPSS (16:15min) and 3D vfl-FSE (13:56min). However, only 6 echo times were acquired with 3D-MAPSS and 3D vfl-FSE sequences (33) while we acquired 10 TEs resulting in a better T2 estimation. The acquisition time of 8:54 min using quantitative DESS (qDESS) scans in Matzat study (33) is roughly half of our scan time. However, with only two echoes, this sequence cannot be used for biexponential relaxation estimation. We plan to reduce the total scan time by applying compressed sensing (34) in addition to parallel imaging in the future.
Reiter et al. (35) presented a method to measure multiexponential T2 relaxation in the bovine nasal cartilage of a mature cow. Three components were detected: T2,1 = 2.3ms, T2,2 = 25.2 ms, and T2,3 = 96.3 ms, with fractions a1 = 6.2%, a2 = 14.5%, and a3 = 79.3% and the authors confirmed that the shortest component T2,1 is related to the immobile collagen-bound water while T2,2 and T2,3 correspond to the water compartments that are bound and loosely related to PG respectively (35). Comparing to our experiment, using biexponential fitting instead of multiexponential, our short component T2s = 7.6ms, as = 41% is related to the water tightly bound to PG and collagen macromolecules while the long component T2l = 46.0ms, al = 59% corresponds to water associated with loosely bound to PG and collagen macromolecules. Our estimated fractions follow the same pattern as the one observed in Reiter et al. (35), where the largest component has higher fraction than the short component. Using our current protocol, we cannot measure the water related to immobile collagen itself - since the echo time is longer that the ultrashort T2 of collagen (0.2–1ms). We plan to modify a UTE-based sequence (36) in the future to measure the ultrashort T2 components.
Liu et al. (17–19) measured two components of T2 relaxation of the human knee joint using multicomponent driven equilibrium single shot observation of T1 and T2 (mcDESPOT) technique (17,20,21). First, they showed the feasibility of using the method for in-vivo T2 measurement in different regions of interest (17) and then compared the relaxation values between asymptomatic volunteers and patients with OA (18). The estimated values of the single, short and long T2 relaxation time in these studies (17,18) for asymptomatic volunteers (~ 35.5ms, 16ms, 62 ms ) were higher than our measurements (~27ms, 7.5ms, 46ms) while the fraction of the short component is lower (31% vs 41%). In their next study, Liu et al.(19) proposed a multicomponent T2 analysis method with synovial fluid partial volume correction. Using the three-pool model instead of two-pool model they claimed that they corrected the T2 bias and as a result estimated a shorter long T2 component (~53ms) which is closer to our estimation (~46ms). However, the short T2 component and its fraction still suffer from PVE (19). We employed a 2mm slice thickness rather than 3 mm used in these studies so the T2 estimation would be more accurate. Another drawback of the mcDESPOT method is that the mcDESPOT parameters could be affected by the magnetization transfer (MT) effect (19,23) and as a result less accurate T2 estimation. Our proposed method does not suffer from MT due to the long delay in the sequence for T1 recovery. In addition, our method has a shorter acquisition time (15min vs 17min) while acquiring thinner slices. Recently a method called mcRISE has been proposed by Liu et al(37) to correct the MT effect at the cost of increasing the acquisition time from 17min (mcDESPOT) to 25min.
Several studies have reported in-vivo bicomponent T2* measurement in different anatomic locations including articular cartilage (27) and the meniscus (26). The estimated T2* relaxation in (27) is in agreement with our T2 estimation since all the mono, short and long T2* components are shorter than the estimated T2 in our studies.
Li X et al. (31) investigated the repeatability of T2 relaxation time measurement and the CVrms of 4.2%–8.5% has been reported across all the ROIs. Their numbers are in good agreement with our experiments where the CVrms of 4.4%-11.5% was measured for monoexponential T2. Mosher et al. (38) investigated the reproducibility of measuring T2 in the healthy control group and osteoarthritis (OA) volunteers (CVrms: 8.12%-10.95% in the healthy volunteers). Similar results were also observed in our study. The good agreement was also observed if we compare the CVrms in different ROIs. Note that the reproducibility was evaluated in Mosher study by acquiring the data from different sites while we investigated the repeatability by acquiring all the data on the same scanner.
Qian et al.(27) evaluated the repeatability of two-component T2* estimations in knee articular cartilage. Similar to our study, they observed better repeatability in the long-T2 component (CVrms ~8%) than in the short-T2 component (~12%).
Our study has some limitations. First, there were a small number of volunteers. Second, the biexponential condition of 4×Ts < Tl may produce some bias. We chose this condition based on the suggestion in (26) and confirmed it with our own experiments. Moreover, the magic angle effect can influence T2 values due to the dipolar interactions of fiber orientation with respect to B0. As shown by Henkelman et al. (39) in bovine articular cartilage, the biexponential behavior disappeared when the tissue’s orientation to B0 is about 55(40). Finally, only asymptomatic volunteers were included in this study and we didn’t perform validation with cartilage histology/biochemical assay or in knee OA patients with symptoms.
In conclusion, in this study, biexponential T2 relaxation of human knee articular cartilage is estimated in-vivo on a 3T MRI scanner in clinically feasible scan times. The short component corresponds to the water tightly bound to PG and collagen macromolecules while the long component is expected to be affected by loosely bound water. Our preliminary results show that biexponential T2 mapping could potentially be used to increase the specificity of early osteoarthritis diagnosis by estimating the relaxation time of different water compartments and their fractions.
Table 2.
The intra-subject repeatability.
| T2m
|
T2s
|
T2l
|
as
|
al
|
|||||||||||
|---|---|---|---|---|---|---|---|---|---|---|---|---|---|---|---|
| ROI | Mean (ms) |
SD (ms) |
CV (%) |
Mean (ms) |
SD (ms) |
CV (%) |
Mean (ms) |
SD (ms) |
CV (%) |
Mean (ms) |
SD (ms) |
CV (%) |
Mean (ms) |
SD (ms) |
CV (%) |
| MTC | 24.5 | 2.1 | 8.7 | 7.8 | 0.1 | 0.9 | 45.5 | 0.7 | 1.6 | 43.5 | 6.4 | 14.6 | 56.5 | 6.4 | 11.3 |
| MFC | 29.5 | 0.7 | 2.4 | 7.6 | 0.1 | 1.9 | 50.0 | 1.4 | 2.8 | 41.0 | 1.4 | 3.4 | 59.0 | 1.4 | 2.4 |
| LTC | 25.5 | 0.7 | 2.8 | 6.8 | 0.6 | 8.3 | 41.5 | 2.1 | 5.1 | 38.0 | 5.7 | 14.9 | 62.0 | 5.7 | 9.1 |
| LFC | 21.5 | 0.7 | 3.3 | 6.5 | 0.4 | 5.5 | 42.0 | 4.2 | 10.1 | 45.0 | 7.1 | 15.7 | 55.0 | 7.1 | 12.9 |
| PC | 27.0 | 2.8 | 10.5 | 6.4 | 0.1 | 1.1 | 37.5 | 2.1 | 5.7 | 30.0 | 5.7 | 18.9 | 70.0 | 5.7 | 8.1 |
Acknowledgments
This study was supported by NIH grants R01-AR060238, R01 AR067156, and R01 AR068966, and was performed under the rubric of the Center of Advanced Imaging Innovation and Research (CAI2R), a NIBIB Biomedical Technology Resource Center (NIH P41 EB017183).
References
- 1.Brandt KD, Doherty M, Lohmander LS. Osteoarthritis. Oxford University Press; 1998. [Google Scholar]
- 2.Bonnin M, Chambat P. Osteoarthritis of the knee. Springer Paris; 2008. [Google Scholar]
- 3.Chan WP, Lang P, Stevens MP, et al. Osteoarthritis of the knee: comparison of radiography, CT, MR imaging to assess extent and severity. AJR American journal of roentgenology. 1991;157(4):799–806. doi: 10.2214/ajr.157.4.1892040. [DOI] [PubMed] [Google Scholar]
- 4.Regatte RR, Akella SV, Lonner J, Kneeland J, Reddy R. T1ρ relaxation mapping in human osteoarthritis (OA) cartilage: comparison of T1ρ with T2. Journal of Magnetic Resonance Imaging. 2006;23(4):547–553. doi: 10.1002/jmri.20536. [DOI] [PubMed] [Google Scholar]
- 5.Li X, Benjamin MaC, Link TM, et al. In vivo T1ρ and T2 mapping of articular cartilage in osteoarthritis of the knee using 3 T MRI. Osteoarthritis and Cartilage. 2007;15(7):789–797. doi: 10.1016/j.joca.2007.01.011. [DOI] [PMC free article] [PubMed] [Google Scholar]
- 6.Gray ML, Burstein D, Xia Y. Seminars in musculoskeletal radiology. Vol. 5. Thieme Medical Publishers; 2001. Biochemical (and functional) imaging of articular cartilage; pp. 329–344. [DOI] [PubMed] [Google Scholar]
- 7.Zheng S, Xia Y. Multi-components of T 2 relaxation in ex vivo cartilage and tendon. Journal of Magnetic Resonance. 2009;198(2):188–196. doi: 10.1016/j.jmr.2009.02.005. [DOI] [PMC free article] [PubMed] [Google Scholar]
- 8.David-Vaudey E, Ghosh S, Ries M, Majumdar S. T 2 relaxation time measurements in osteoarthritis. Magnetic resonance imaging. 2004;22(5):673–682. doi: 10.1016/j.mri.2004.01.071. [DOI] [PubMed] [Google Scholar]
- 9.Dardzinski BJ, Mosher TJ, Li S, Van Slyke MA, Smith MB. Spatial variation of T2 in human articular cartilage. Radiology. 1997;205(2):546–550. doi: 10.1148/radiology.205.2.9356643. [DOI] [PubMed] [Google Scholar]
- 10.Mosher TJ, Dardzinski BJ, Smith MB. Human Articular Cartilage: Influence of Aging and Early Symptomatic Degeneration on the Spatial Variation of T2—Preliminary Findings at 3 T 1. Radiology. 2000;214(1):259–266. doi: 10.1148/radiology.214.1.r00ja15259. [DOI] [PubMed] [Google Scholar]
- 11.Mlynarik V, Trattnig S, Huber M, Zembsch A, Imhof H. The role of relaxation times in monitoring proteoglycan depletion in articular cartilage. Journal of Magnetic Resonance Imaging. 1999;10(4):497–502. doi: 10.1002/(sici)1522-2586(199910)10:4<497::aid-jmri1>3.0.co;2-t. [DOI] [PubMed] [Google Scholar]
- 12.Nishioka H, Nakamura E, Hirose J, Okamoto N, Yamabe S, Mizuta H. MRI T1ρ and T2 mapping for the assessment of articular cartilage changes in patients with medial knee osteoarthritis after hemicallotasis osteotomy. Bone and Joint Research. 2016;5(7):294–300. doi: 10.1302/2046-3758.57.BJR-2016-0057.R1. [DOI] [PMC free article] [PubMed] [Google Scholar]
- 13.Hahn EL. Spin echoes. Physical review. 1950;80(4):580. [Google Scholar]
- 14.Staroswiecki E, Granlund KL, Alley MT, Gold GE, Hargreaves BA. Simultaneous estimation of T2 and apparent diffusion coefficient in human articular cartilage in vivo with a modified three-dimensional double echo steady state (DESS) sequence at 3 T. Magnetic resonance in medicine. 2012;67(4):1086–1096. doi: 10.1002/mrm.23090. [DOI] [PMC free article] [PubMed] [Google Scholar]
- 15.Welsch GH, Mamisch TC, Zak L, et al. Morphological and biochemical T2 evaluation of cartilage repair tissue based on a hybrid double echo at steady state (DESS-T2d) approach. Journal of magnetic resonance imaging. 2011;34(4):895–903. doi: 10.1002/jmri.22677. [DOI] [PubMed] [Google Scholar]
- 16.Wang L, Regatte RR. T1ρ MRI of human musculoskeletal system. Journal of Magnetic Resonance Imaging. 2015;41(3):586–600. doi: 10.1002/jmri.24677. [DOI] [PMC free article] [PubMed] [Google Scholar]
- 17.Liu F, Chaudhary R, Hurley SA, et al. Rapid multicomponent T2 analysis of the articular cartilage of the human knee joint at 3.0 T. Journal of Magnetic Resonance Imaging. 2014;39(5):1191–1197. doi: 10.1002/jmri.24290. [DOI] [PubMed] [Google Scholar]
- 18.Liu F, Choi KW, Samsonov A, et al. Articular cartilage of the human knee joint: in vivo multicomponent T2 analysis at 3.0 T. Radiology. 2015;277(2):477–488. doi: 10.1148/radiol.2015142201. [DOI] [PMC free article] [PubMed] [Google Scholar]
- 19.Liu F, Chaudhary R, Block WF, Samsonov A, Kijowski R. Multicomponent T2 analysis of articular cartilage with synovial fluid partial volume correction. Journal of Magnetic Resonance Imaging. 2015 doi: 10.1002/jmri.25061. [DOI] [PMC free article] [PubMed] [Google Scholar]
- 20.Deoni SC, Rutt BK, Arun T, Pierpaoli C, Jones DK. Gleaning multicomponent T1 and T2 information from steady-state imaging data. Magnetic Resonance in Medicine. 2008;60(6):1372–1387. doi: 10.1002/mrm.21704. [DOI] [PubMed] [Google Scholar]
- 21.Deoni SC, Matthews L, Kolind SH. One component? Two components? Three? The effect of including a nonexchanging “free” water component in multicomponent driven equilibrium single pulse observation of T1 and T2. Magnetic resonance in medicine. 2013;70(1):147–154. doi: 10.1002/mrm.24429. [DOI] [PMC free article] [PubMed] [Google Scholar]
- 22.Deoni SC, Rutt BK, Jones DK. Investigating the effect of exchange and multicomponent T1 relaxation on the short repetition time spoiled steady-state signal and the DESPOT1 T1 quantification method. Journal of Magnetic Resonance Imaging. 2007;25(3):570–578. doi: 10.1002/jmri.20836. [DOI] [PubMed] [Google Scholar]
- 23.Zhang J, Kolind SH, Laule C, MacKay AL. How does magnetization transfer influence mcDESPOT results? Magnetic resonance in medicine. 2015;74(5):1327–1335. doi: 10.1002/mrm.25520. [DOI] [PubMed] [Google Scholar]
- 24.Qian Y, Williams AA, Chu CR, Boada FE. Multicomponent T2* mapping of knee cartilage: technical feasibility ex vivo. Magnetic resonance in medicine. 2010;64(5):1426–1431. doi: 10.1002/mrm.22450. [DOI] [PMC free article] [PubMed] [Google Scholar]
- 25.Griswold MA, Jakob PM, Heidemann RM, et al. Generalized autocalibrating partially parallel acquisitions (GRAPPA) Magnetic resonance in medicine. 2002;47(6):1202–1210. doi: 10.1002/mrm.10171. [DOI] [PubMed] [Google Scholar]
- 26.Juras V, Apprich S, Zbýň Š, et al. Quantitative MRI analysis of menisci using biexponential T2* fitting with a variable echo time sequence. Magnetic resonance in medicine. 2014;71(3):1015–1023. doi: 10.1002/mrm.24760. [DOI] [PMC free article] [PubMed] [Google Scholar]
- 27.Qian Y, Williams AA, Chu CR, Boada FE. Repeatability of ultrashort echo time-based two-component T2* measurements on cartilages in human knee at 3 T. Magnetic resonance in medicine. 2013;69(6):1564–1571. doi: 10.1002/mrm.24392. [DOI] [PMC free article] [PubMed] [Google Scholar]
- 28.Stahl R, Luke A, Li X, et al. T1rho, T2 and focal knee cartilage abnormalities in physically active and sedentary healthy subjects versus early OA patients—a 3.0-Tesla MRI study. European radiology. 2009;19(1):132–143. doi: 10.1007/s00330-008-1107-6. [DOI] [PubMed] [Google Scholar]
- 29.Zarins ZA, Bolbos RI, Pialat JB, et al. Cartilage and meniscus assessment using T1rho and T2 measurements in healthy subjects and patients with osteoarthritis. Osteoarthritis and Cartilage. 2010;18(11):1408–1416. doi: 10.1016/j.joca.2010.07.012. [DOI] [PMC free article] [PubMed] [Google Scholar]
- 30.Schooler J, Kumar D, Nardo L, et al. Longitudinal evaluation of T1ρ and T2 spatial distribution in osteoarthritic and healthy medial knee cartilage. Osteoarthritis and Cartilage. 2014;22(1):51–62. doi: 10.1016/j.joca.2013.10.014. [DOI] [PMC free article] [PubMed] [Google Scholar]
- 31.Li X, Wyatt C, Rivoire J, et al. Simultaneous acquisition of T1ρ and T2 quantification in knee cartilage: repeatability and diurnal variation. Journal of Magnetic Resonance Imaging. 2014;39(5):1287–1293. doi: 10.1002/jmri.24253. [DOI] [PMC free article] [PubMed] [Google Scholar]
- 32.Chaudhari AS, Sveinsson B, Moran CJ, et al. Imaging and T2 relaxometry of short-T2 connective tissues in the knee using ultrashort echo-time double-echo steady-state (UTEDESS) Magnetic Resonance in Medicine. 2017 doi: 10.1002/mrm.26577. [DOI] [PMC free article] [PubMed] [Google Scholar]
- 33.Matzat SJ, McWalter EJ, Kogan F, Chen W, Gold GE. T2 Relaxation time quantitation differs between pulse sequences in articular cartilage. Journal of Magnetic Resonance Imaging. 2015;42(1):105–113. doi: 10.1002/jmri.24757. [DOI] [PMC free article] [PubMed] [Google Scholar]
- 34.Huang C, Graff CG, Clarkson EW, Bilgin A, Altbach MI. T2 mapping from highly undersampled data by reconstruction of principal component coefficient maps using compressed sensing. Magnetic resonance in medicine. 2012;67(5):1355–1366. doi: 10.1002/mrm.23128. [DOI] [PMC free article] [PubMed] [Google Scholar]
- 35.Reiter DA, Lin PC, Fishbein KW, Spencer RG. Multicomponent T2 relaxation analysis in cartilage. Magnetic resonance in medicine. 2009;61(4):803–809. doi: 10.1002/mrm.21926. [DOI] [PMC free article] [PubMed] [Google Scholar]
- 36.Du J, Diaz E, Carl M, Bae W, Chung CB, Bydder GM. Ultrashort echo time imaging with bicomponent analysis. Magnetic resonance in medicine. 2012;67(3):645–649. doi: 10.1002/mrm.23047. [DOI] [PubMed] [Google Scholar]
- 37.Liu F, Block WF, Kijowski R, Samsonov A. Rapid multicomponent relaxometry in steady state with correction of magnetization transfer effects. Magnetic resonance in medicine. 2015 doi: 10.1002/mrm.25672. [DOI] [PMC free article] [PubMed] [Google Scholar]
- 38.Mosher TJ, Zhang Z, Reddy R, et al. Knee articular cartilage damage in osteoarthritis: analysis of MR image biomarker reproducibility in ACRIN-PA 4001 multicenter trial. Radiology. 2011;258(3):832–842. doi: 10.1148/radiol.10101174. [DOI] [PMC free article] [PubMed] [Google Scholar]
- 39.Henkelman RM, Stanisz GJ, Kim JK, Bronskill MJ. Anisotropy of NMR properties of tissues. Magnetic resonance in medicine. 1994;32(5):592–601. doi: 10.1002/mrm.1910320508. [DOI] [PubMed] [Google Scholar]
- 40.Li X, Cheng J, Lin K, et al. Quantitative MRI using T 1ρ and T 2 in human osteoarthritic cartilage specimens: correlation with biochemical measurements and histology. Magnetic resonance imaging. 2011;29(3):324–334. doi: 10.1016/j.mri.2010.09.004. [DOI] [PMC free article] [PubMed] [Google Scholar]


