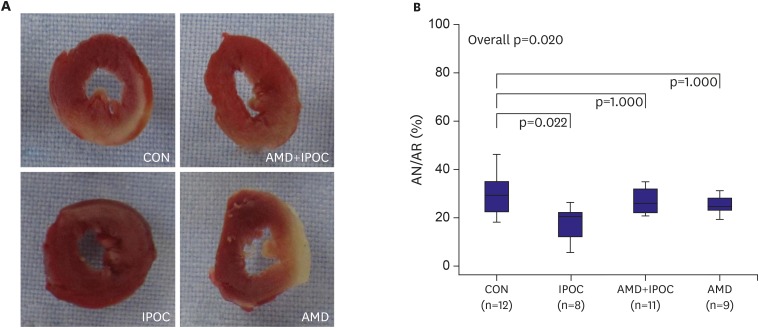
Figure 2.
(A) Representative sequential LV slices from each group showing the AN (pale area) with TTC staining. (B) Percent of infarct area over AR.
All data are expressed as mean±standard deviation. There were significant differences between p=0.021 vs. CON group and p=0.045 vs. AMD+IPOC group.
AMD = AMD3100 treatment in CON (n=9); AMD+IPOC = CXCR4 antagonist AMD3100 treatment in IPOC (n=11); AN = area of necrosis; AR = area at risk; CON = untreated control hearts (n=12); IPOC = ischemic postconditioning (n=8); TTC = 2,3,5-triphenyltetrazolium chloride.

