Figure 5.
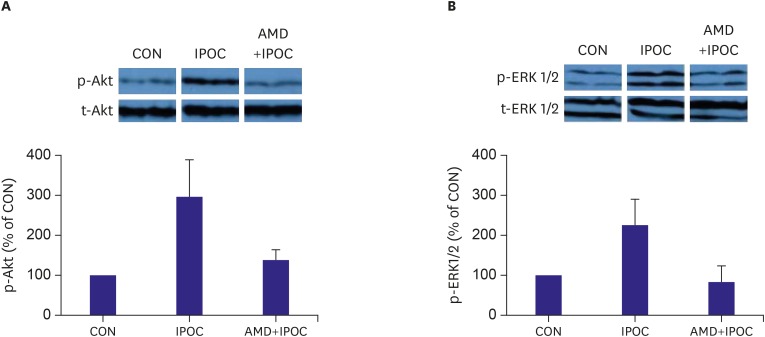
(A) Representative western blotting for p-Akt and t-Akt intensity. (B) Representative western blotting for p-ERK1/2 and t-ERK1/2 intensity. Bar graph shows percentage change in ERK1/2 and Akt phosphorylation relative to CON group.
Increased phosphorylation of Akt and ERK1/2 in IPOC-induced hearts was totally blocked by AMD3100. Data are expressed as mean±standard deviation. p<0.050 vs. CON group.
AMD = AMD3100 treatment in CON (n=9); AMD+IPOC = CXCR4 antagonist AMD3100 treatment in IPOC (n=11); CON = untreated control hearts (n=12); IPOC = ischemic postconditioning (n=8); p-Akt = phospho-Akt; p-ERK1/2 = phospho-extracellular signal-regulated kinase 1/2; t-Akt = total-Akt; t-ERK1/2 = total-extracellular signal-regulated kinase 1/2.

