Fig. 2.

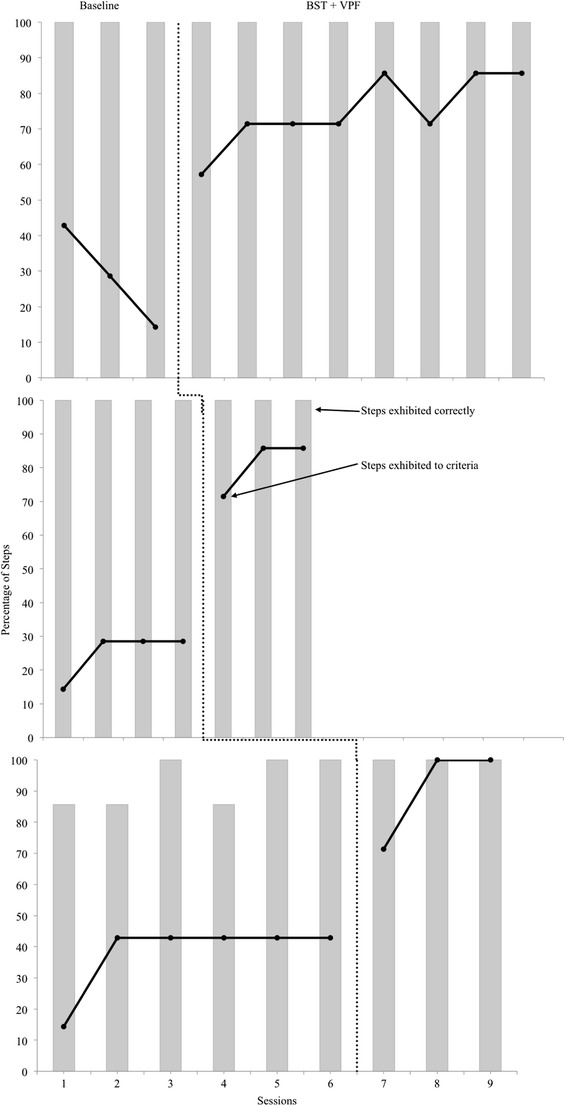
Performance data for staff members 4–6. Percentages of skills correctly implemented per session are represented by gray bars. Percentages of skills implemented to criteria per session are represented by the black data path

Performance data for staff members 4–6. Percentages of skills correctly implemented per session are represented by gray bars. Percentages of skills implemented to criteria per session are represented by the black data path