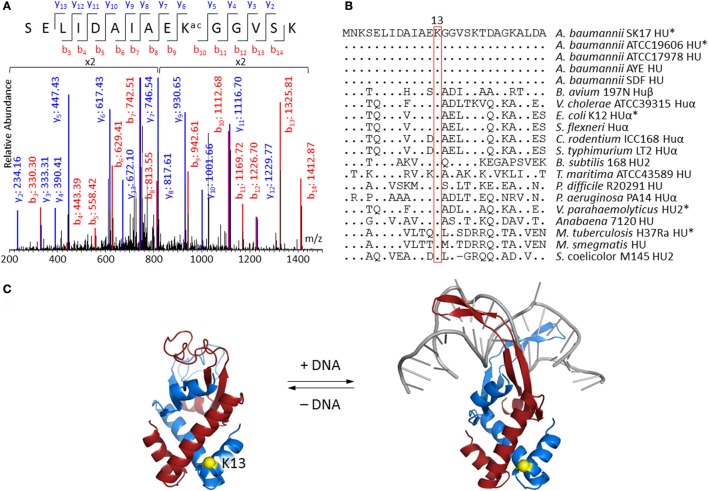
Figure 2.
Acetylation at Lys13 of HU. (A) MS/MS spectrum showing Lys13 acetylation in A. baumannii SK17 HU. MS/MS spectra of all identified acetylated peptides are shown in Supplemental Data. (B) Sequence alignment of bacterial HU homologs. Sequences were aligned to amino acid residues 1–27 of A. baumannii SK17 HU. Dot (.) and hyphen (−) indicates identical amino acid residues and gap, respectively, in comparison to A. baumannii SK17 HU sequence. Proteins known to be acetylated at Lys13 are shown with asterisk (*). Full sequence alignment with all known acetylation sites is shown in Figure S2. (C) Homology models of A. baumannii HU. Homology model without or with DNA was generated by SWISS-MODEL using pdb 4P3V or 1P51 as the template. DNA is shown in gray. Two subunits of the homodimer are shown in blue and red. Lys13 of one subunit is shown in yellow. Alignment of the homology models is shown in Figure S3.

