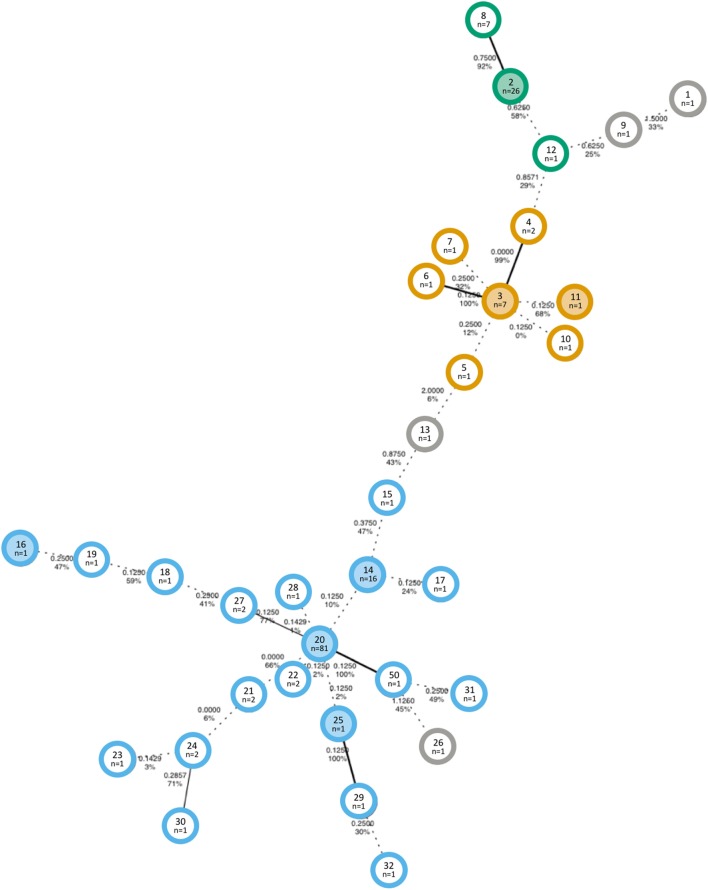
Figure 1.
Minimum spanning tree with the highest bootstrap value of Shiga toxin-producing Escherichia coli O157 isolates collected in an Australian beef herd over a period of 9 months. The distances represent the arithmetic pairwise distance of alleles at eight VNTR loci and are shown on the connecting edges of the tree. Bootstrap support values are also indicated. Edges with less than 70% bootstrap support are depicted by dashed lines. Colors indicate the genetic cluster (GC): GC1 = blue, GC2 = orange, GC3 = green, and unclustered = grey; and shaded nodes indicate that at least one isolate of that MLVA type was analyzed by whole-genome sequencing. The text in the center of each node displays the MLST type (top) with the number of isolates of that type (bottom).

