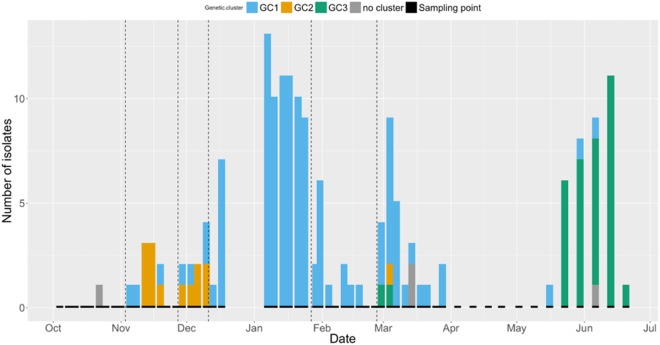
Figure 3.
Bar chart displaying the number of Shiga toxin-producing Escherichia coli O157 isolates at each sampling point (indicated by short black bars) between 4th October 2012 and 20th June 2013. Colors indicate the genetic cluster (GC): GC1 = blue, GC2 = orange, GC3 = green, and unclustered = gray. Dashed vertical lines indicate change of paddock.

