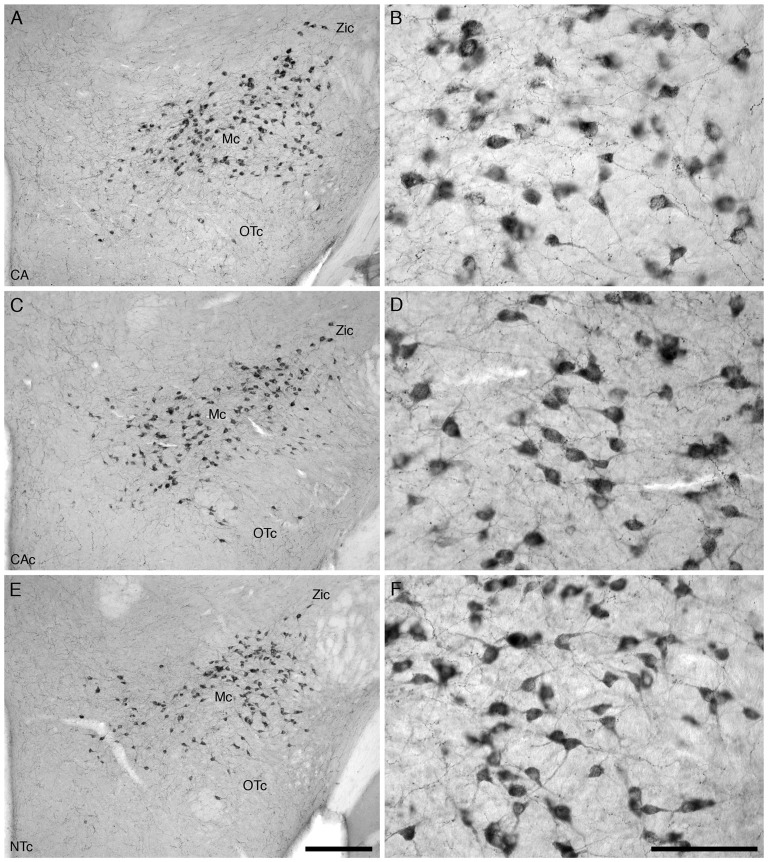
Figure 6.
Lower (A,C,E) and higher (B,D,F) magnification photomicrographs of the hypothalamic orexinergic neurons of the mouse in the coronal plane immunostained for OxA in the three different groups analyzed in the present study, the group exposed to chronic prenatal alcohol (CA) (A,B), the prenatal gavage control group (CAc) (C,D) and the NTc (E,F). The nuclear organization and number of OxA immunostained cells was similar between groups, but the soma of the neurons in the CA group, exposed to chronic prenatal alcohol, were statistically significantly larger than the two control groups (CAc and NTc). In all images dorsal is to the top and medial to the left. Scale bar in (E) = 250 μm and applies to (A,C,E), scale bar in (F) = 100 μm and applies to (B,D,F). Mc, main orexinergic cluster; OTc, optic tract cluster; Zic, zona incerta cluster.

