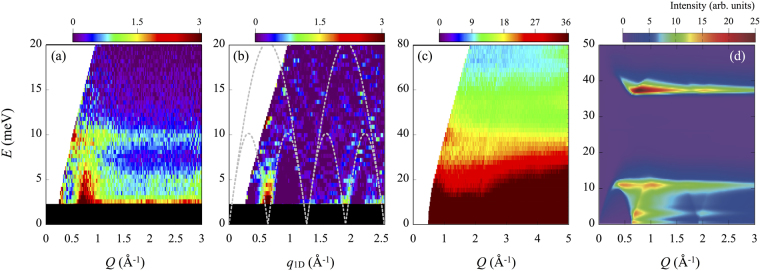
Figure 2.
INS spectra for K3Cu3AlO2(SO4)4. (a) Magnetic scattering contribution, extracted the 100 K data from the 4 K data corrected for the phonon population factor (E i = 45.95 meV). (b) Single-crystal-like data obtained by applying the conversion method. The superimposed gray dashed lines indicate the lower and upper energy boundaries of the continuum given by (πJ d/2)|sin(Qa)| and πJ d|sin(Qa/2)|13, respectively, where a is the lattice parameter in the chain direction. (c) Experimental raw data measured at 4 K with incident neutron energy of 205.8 meV. (d) Simulated powder-averaged INS spectrum.

