Figure 8.
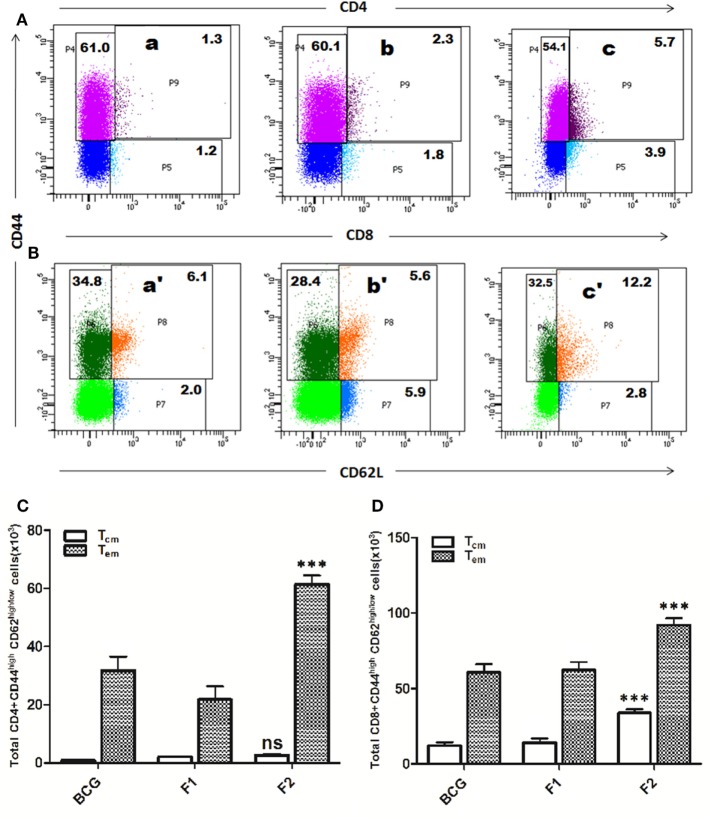
Immunization schedule involving Ag85B aggregates evokes antigen-specific T cell memory (effector/central) response in the host. The splenocytes were isolated from various immunized groups at 1 week post booster and analyzed for the presence of CD44high, CD62Llow/high CD4+, and CD8+ T cells. The representative FACS dot plots of gated (A) CD4+ T cells, and (B) CD8+ T cells belonging to various immunized groups are denoted in the upper panel. Various experimental groups included in the study were: Bacillus Calmette–Guerin (BCG) (a and a′), Ag85B-IFA or F1 (b and b′), and amyloidal aggregate form of Ag85B or F2 (c and c′). Graphs in the lower panel (C,D) depict quantitave data of analyzed memory markers belonging to corresponding CD4+ and CD8+ T cells. Bar graphs indicate total number of CD4+ CD44high, CD62Llow/high (C), and CD8+ CD44high, CD62Llow/high (D) cells, respectively, in various groups. The data were analyzed by employing two-way ANOVA followed by Bonferroni’s multiple comparison test and are shown as means (±SD) of three independent experiments. (C) Aggregated Ag85B (F2) Vs BCG: p < 0.001 CD4+ Teffector memory; p = ns CD4+ Tcentral memory; Ag85B-IFA (F1) Vs BCG: p < 0.01 CD4+ Teffector memory; p = ns CD4+ Tcentral memory, aggregated Ag85B (F2) Vs Ag85B-IFA (F1): p < 0.001 CD4+ Teffector memory; p = ns CD4+ Tcentral memory. (D) Aggregated Ag85B (F2) Vs BCG: p < 0.001 CD8+ Teffector memory, CD8+ Tcentral memory; Ag85B-IFA (F1) Vs BCG: p = ns CD8+ Teffector memory; CD8+ Tcentral memory, aggregated Ag85B (F2) Vs Ag85B-IFA (F1): p < 0.001 CD8+ Teffector memory; CD8+ Tcentral memory.

