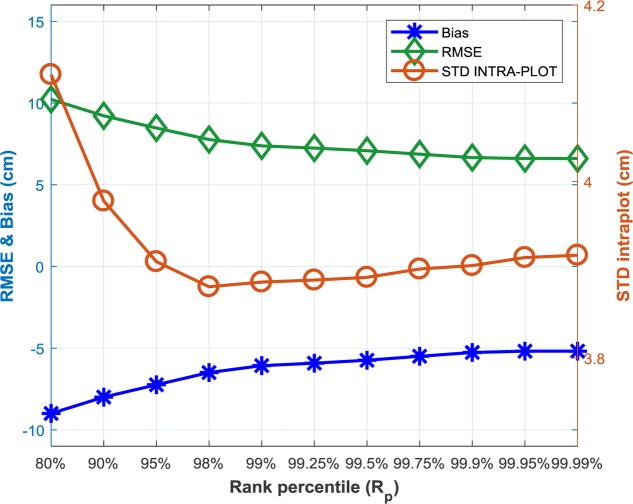
FIGURE 7.
Impact of the rank percentile (Rp) used to defined plant height from the dense cloud derived from structure from motion on RMSE and bias (left y axis) and the variability of plant height along the microplot (right y axis). The reference plant height used here is that derived from the LiDAR with Rp = 99.5%.

