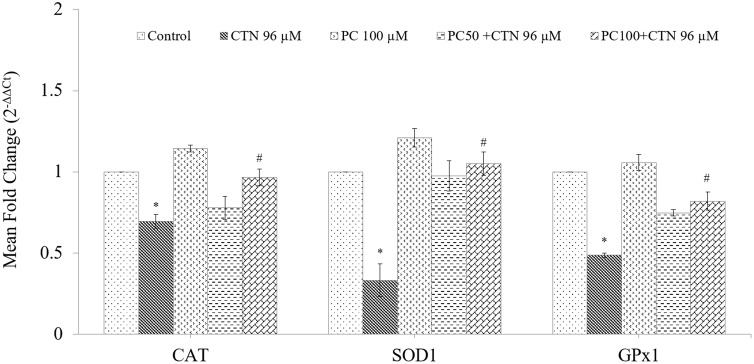
FIGURE 12.
Effect of PC on Nrf2-mediated mRNA expression levels of antioxidant enzymes, CAT, SOD1, and GPx1. mRNA was analyzed by quantitative real-time PCR; normalized gene expression levels are given as the mean fold change. Data are expressed as the mean ± SD (n = 3). ∗p < 0.05 vs. control cells, #p < 0.05 vs. CTN treated cells.

