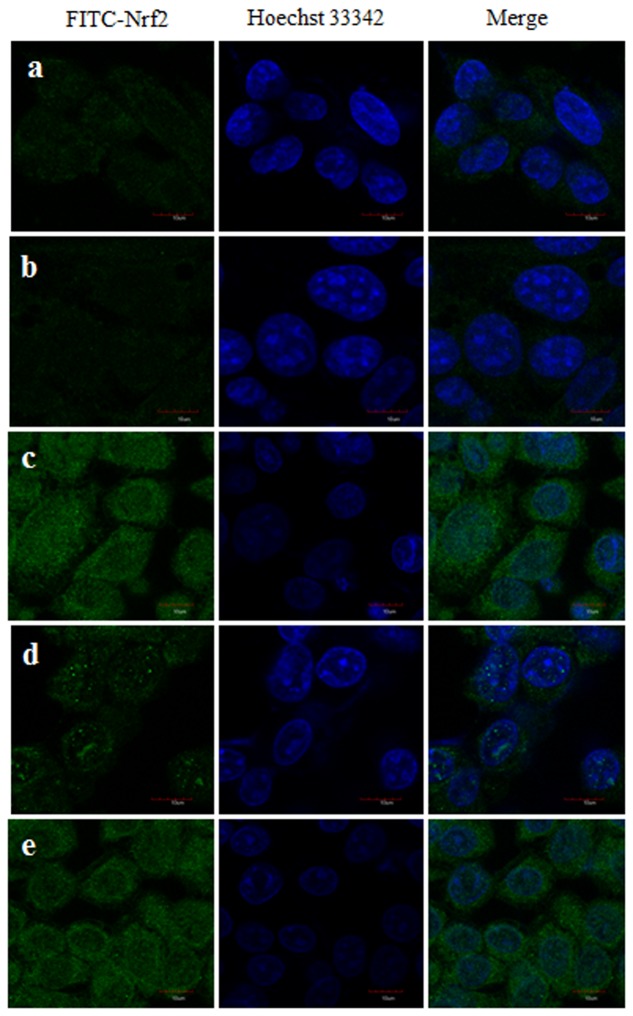
FIGURE 15.
Nrf2 nuclear localization in HepG2 cells was examined by confocal microscopy after pretreatment with PC for 2 h followed by with or without CTN (96 μM) treatment for 24 h (a) Control, (b) CTN 96 μM, (c) PC 100 μM, (d) PC 50 μM + CTN 96 μM, (e) PC 100 μM + CTN 96 μM. Green signals represent nuclear distribution of Nrf2 while nuclei were stained with Hoechst 33342 (blue signal) as assessed by secondary antibody conjugated with FITC staining in laser scanning confocal microscope. Scale bar, 10 μm.

