FIGURE 4.
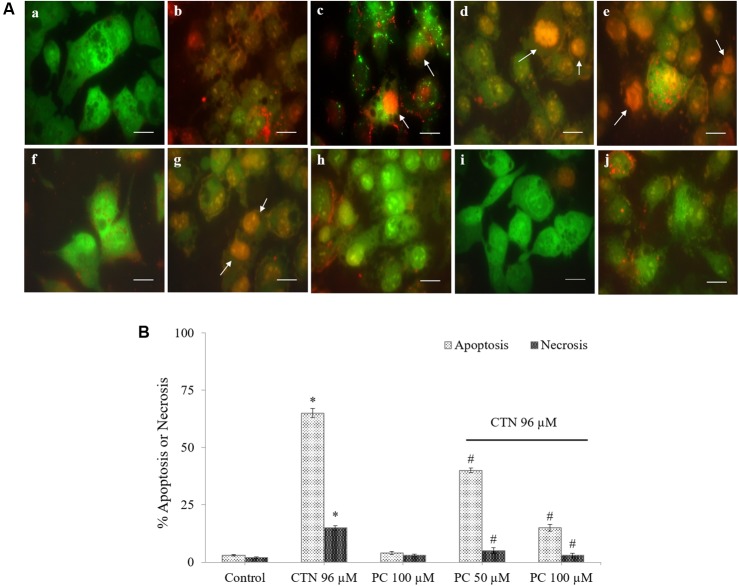
Representative photomicrographs of HepG2 cells stained with acridine orange (AO, green) and ethidium bromide (EtBr, red) fluorescent dyes, (A) Vital cells (green), early apoptotic (bright green to yellow), late apoptotic (orange) and necrotic cells (red). (a) Control, (b–e) CTN 25, 50, 75, and 100 μM, (f) Control, (g) CTN 96 μM, (h) PC 100 μM, (i) PC 50 μM + CTN 96 μM, (j) PC 100 μM + CTN 96 μM. (B) The percentage of apoptotic and necrotic cells after staining with AO and EtBr. Data are expressed as the mean ± SD. ∗p < 0.05 vs. control cells, #p < 0.05 vs. CTN treated cells. Scale bar, 20 μm.

