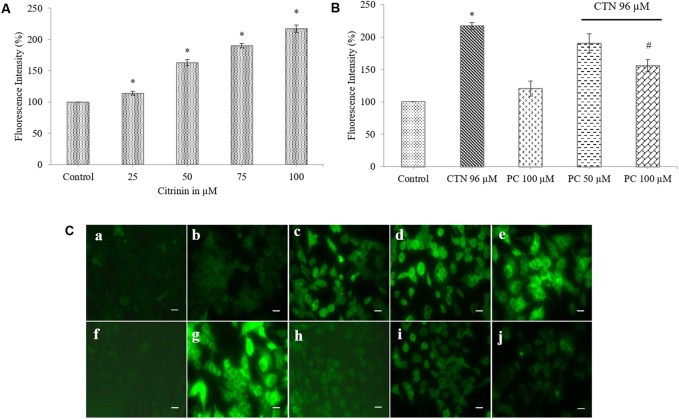
FIGURE 5.
Effect of PC on CTN-induced ROS in HepG2 cells. (A) Cells were treated with CTN for 24 h and then intracellular ROS levels were detected. ROS levels were found to be increased compared to control cells. (B) PC pretreatment for 2 h followed by with or without CTN (96 μM) treatment for 24 h markedly decreased intracellular ROS. (C) Fluorescence images of HepG2 cells stained with H2DCF-DA, ROS accumulation leads to oxidation of the dye resulting in increased DCF fluorescence (green color) (a) Control, (b–e) CTN 25, 50, 75, and 100 μM, (f) Control, (g) CTN 96 μM, (h) PC 100 μM, (i) PC 50 μM + CTN 96 μM, (j) PC 100 μM + CTN 96 μM. Scale bar, 50 μm. Data are expressed as the mean ± SD (n = 3). ∗p < 0.05 vs. control cells, #p < 0.05 vs. CTN treated cells.

