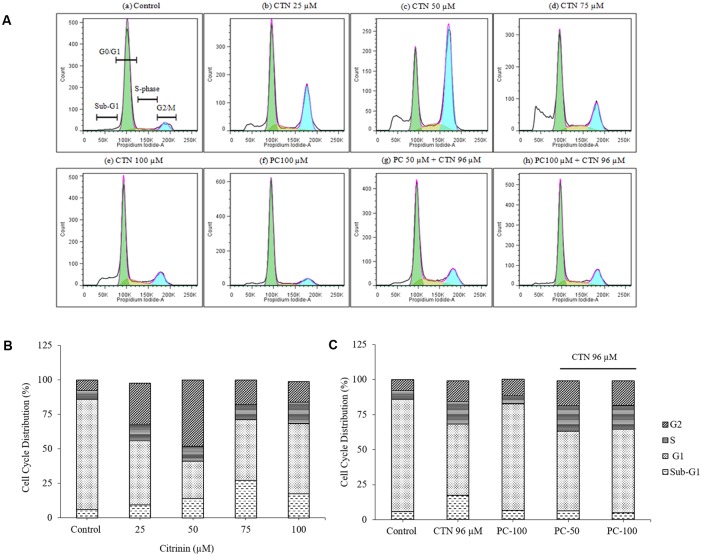
FIGURE 8.
Cell cycle analysis using propidium iodide (PI) staining and flow cytometry. (A) Flow cytometry histogram of HepG2 cells after CTN treatment and compared with pretreatment with PC. (B) Cell cycle phase distribution (%) of 24 h CTN treated HepG2 cells showing G2/M phase arrest and sub-G1 phase. (C) Cell cycle phase distribution (%) of PC pretreated (2 h) cells showing protection after 24 h CTN exposure.

