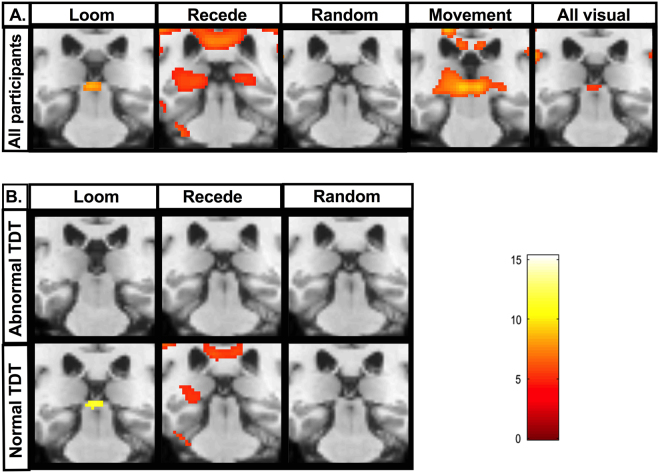
Figure 2.
Whole brain analysis of superior collicular activation to visual stimuli: (A) Whole brain, whole group 2nd level general linear model (GLM) analysis in all 64 participants (16 patients, 32 unaffected relatives, 16 healthy controls) for the following basic contrasts: loom, recede, random, structured movement (loom & recede) and all visual (loom, recede & random). Coronal brain images are displayed. Slices were selected to highlight peak superior collicular activity. A Family wise error corrected p-value < 0.05 is used. K = cluster size. A significant and focal activation of both superior colliculi is seen for the loom condition (K = 69, p < 0.002). The recede random and structured movement conditions failed to demonstrate statistically significant clusters at superior collicular level. (B) Segmented group 2nd level GLM analysis brain analysis in 32 participants with abnormal temporal discrimination thresholds (TDTs) (16 cervical dystonia patients and 16 relatives with abnormal TDTs) and 32 participants with normal TDTs (16 relatives and 16 control participants with normal TDTs). A statistically significant cluster at superior collicular level is observed for the looming condition in the normal TDT group. In the abnormal TDT group, no statistically significant clusters were observed within the superior colliculus boundary for the loom, recede or random condition.

