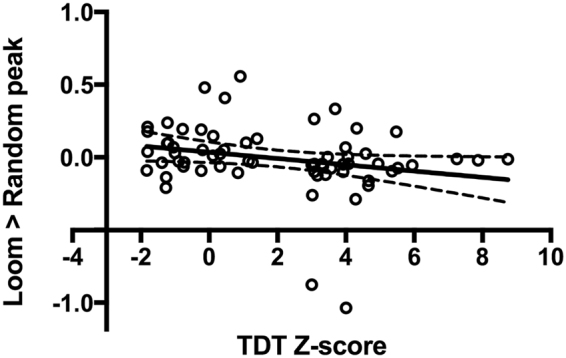
Figure 5.

Correlation analysis: Pearson’s product moment correlation-coefficient analysis examining the relationship between superior collicular peak percent signal change for the loom > random contrast and temporal discrimination threshold (TDT) Z-score. Each open black circle represents one of the 64 participants; TDT Z-scores are plotted on the x-axis; the peak percent signal change observed for the loom > random contrast is plotted on the y-axis. The analysis shows a statistically significant negative correlation between the loom > random contrast and TDT Z-score [r = − 0.25, n = 62, p < 0.04], with lower levels of superior collicular activation associated with a higher (abnormal) TDT Z-score.
