Fig. 3.
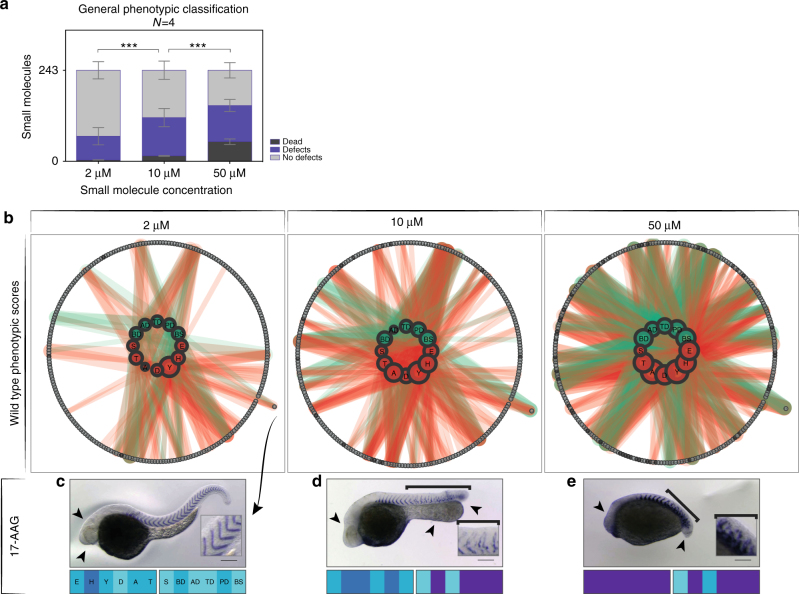
Concentration dependence of phenotype. a Plot showing the number of lethal treatments, treatments showing at least one defect (any parameter > 0), or no defects depending on the concentration as a mean ( ± SD) of four independent experiments (2 wild type replicates, 2 mutant genotypes). Lethal conditions significantly increased with increasing concentration (2-way ANOVA, P < 0.0001). b Wild type_A phenotypic scores across the concentration series illustrated as interaction networks. Inner circles represent phenotypic parameters: morphology in green, segmentation in red. Size of nodes represents the frequency of scoring > 0 for each individual parameter. Interactions to outer circle represent the link of phenotypic parameter to given small molecule (gray circles). Thickness of interaction lines gives magnitude of score. Dark gray circles, lethal treatments. Small molecule names corresponding to numbers can be found in Supplementary Table 1. Small molecule highlighted in outer circle across concentration series is 17-AAG. Representative images shown in c–e. c 2 µM 17-AAG, normal segmentation (inset), mild defects of head (arrowheads) and yolk extension. d 10 µM, defects of the head morphology (arrowhead) and thickened yolk extension (arrowheads), truncated axis and disrupted myotome boundaries posterior to the 8th (bracket). e 50 µM, 17-AAG, strong developmental defects (arrowheads) and disrupted segmentation (bracket, inset). Corresponding phenotypic vector fingerprints below each image show increasing scores for almost all parameters with increasing concentration. Scale bar: 200 µm

