
FIGURE 3.
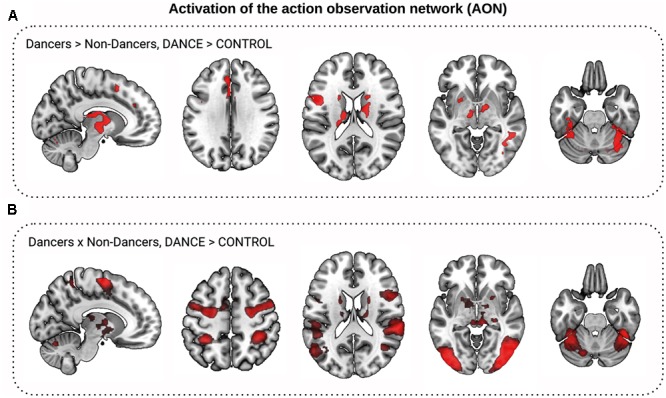
Activation of the action observation network (AON) during dance observation fMRI task. (A,B) Show comparison of Dance to Control video clips observation conditions (DANCE > CONTROL). (A) Dancers activated the AON to a greater extent than Non-Dancers: Dancers showed greater increase in the BOLD signal to Dance than to Control video clips than Non-Dancers in the basal ganglia, higher visual, precentral, and frontal cortex (in red, z > 2.3, corrected). (B) The AON for both Dancers and Non-Dancers (conjunction, in red).