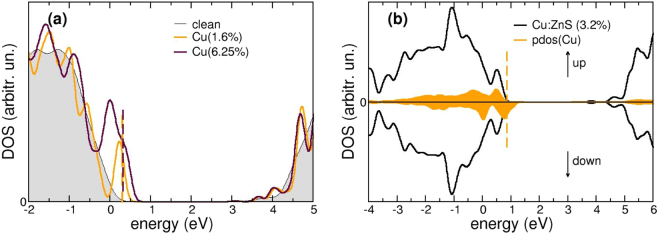
Figure 3.
(a) Modification of the total DOS around the band gap region of ZB-ZnS upon Cu doping at different dosages. (b) Spin-resolved DOS of Cu-doped (3.2%) ZB-ZnS; spin-down states are reported with negative values. The projected DOS on Cu-derived states is also indicated in orange. In all panels, the Fermi Level of the undoped system is chosen as reference (0 eV) for the energy scale, while the dotted line represents the Fermi level of the doped structure.

