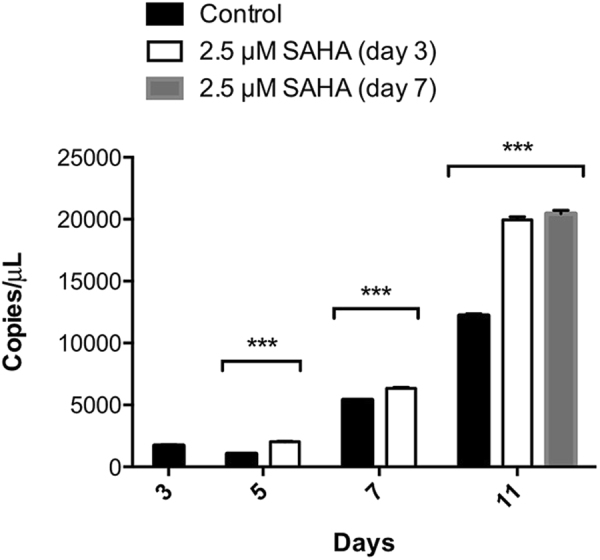
Figure 2.

Gene expression analysis of Medicago cell lines expressing L-PGDS, with and without addition of 2.5 µM SAHA (at days 3 or 7 of growth). The calculated sample quantity (Copies/µL) represents the concentration of the cDNA sample in the PCR reaction mix. ***p value ≤ 0.001. Error bars indicate the theoretical confidence interval based on Poisson distribution calculated by the QS3D Analysis SuiteTM software for n = 6 (control) and n = 3 (SAHA).
