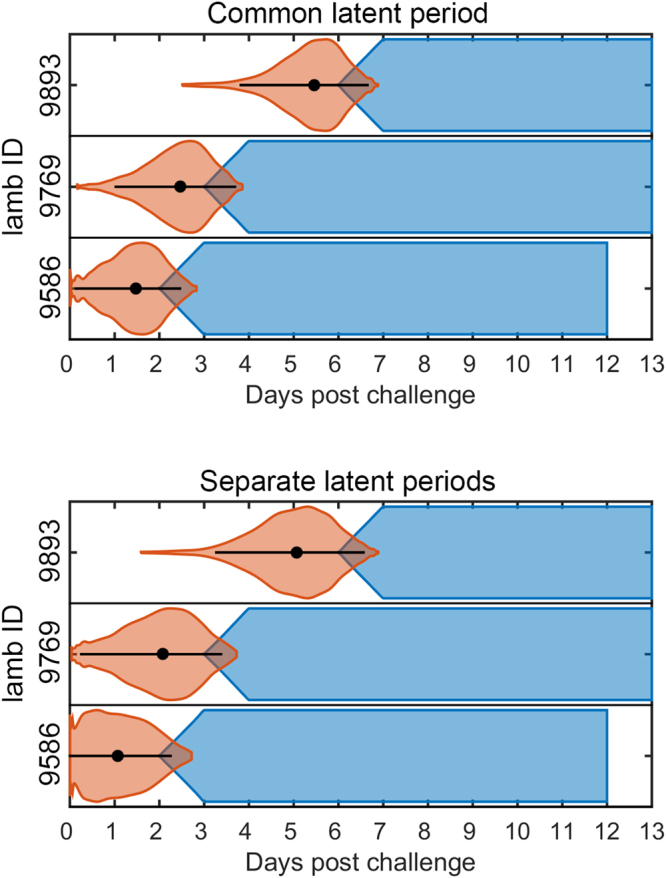
Figure 3.

Inferred infection times for the FMDV in lambs transmission experiment. Orange violin plots showing the densities of the inferred infection times for the contact lambs assuming a common latent period (top panel) or separate latent periods (bottom panel) for inoculated and contact-infected lambs. The black circles and bars denote the posterior median and the 95% highest posterior density interval. The inferred cumulative probability of animals being infectious at each time point are shown in blue.
