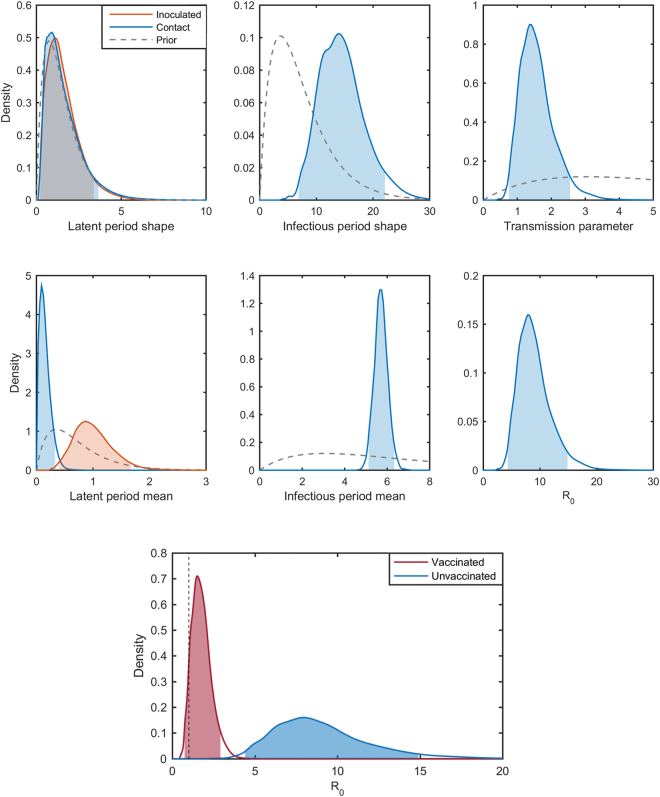
Figure 4.
Epidemiological parameters for foot-and-mouth disease virus (FMDV) in pigs. Marginal posterior distributions for each parameters inferred from the FMDV transmission experiments between unvaccinated pigs (top panel). The latent period shape and mean posteriors are plotted in blue for in-contact pigs and in orange for inoculated. The shaded areas indicate the 95% highest posterior density intervals and priors are plotted as grey dashed lines. Posterior density plots of R 0 for vaccinated pigs in red and unvaccinated pigs in blue (bottom panel), with the shaded areas representing the 95% highest-posterior density interval. The dashed black line indicates the threshold value of R 0 = 1.

