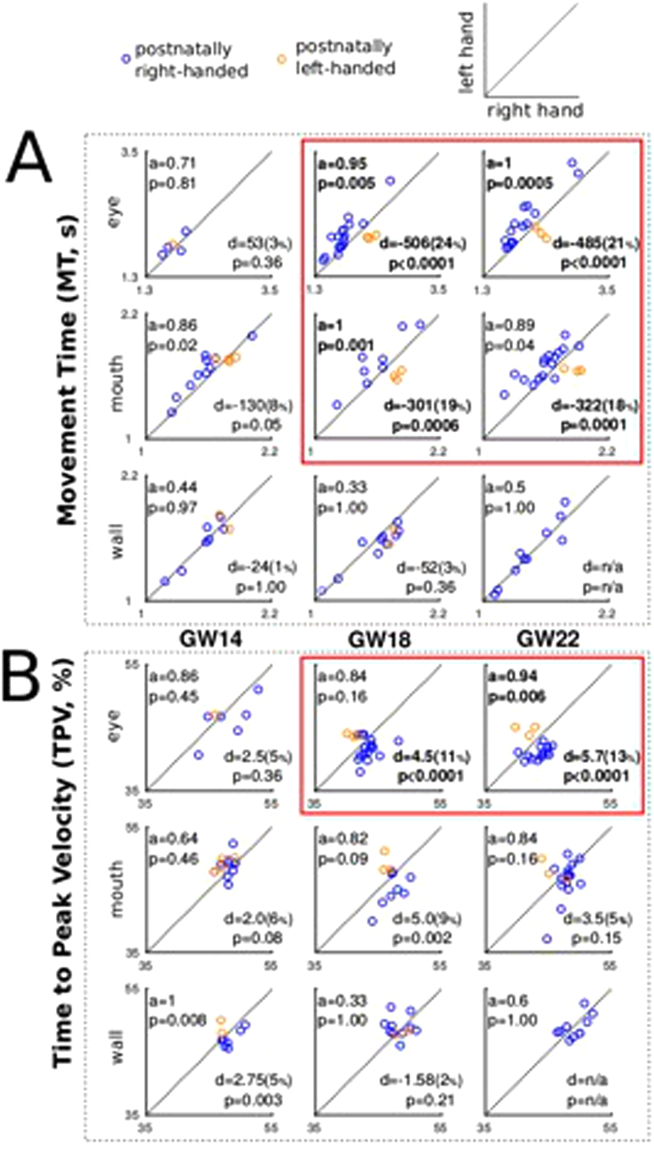
Figure 3.
Identification accuracy (a) of postnatal handedness and Hodges-Lehmann estimate of HAA (d) and rHAA (%) (A) MT observations in seconds and (B) TPV observations in percentage of total MT. Average observations corresponding to movements performed with LH (Y axis) plotted in function of the movements performed with RH (X axis). After correction for multiple comparisons, significant findings are in bold and collectively highlighted by red lines.

