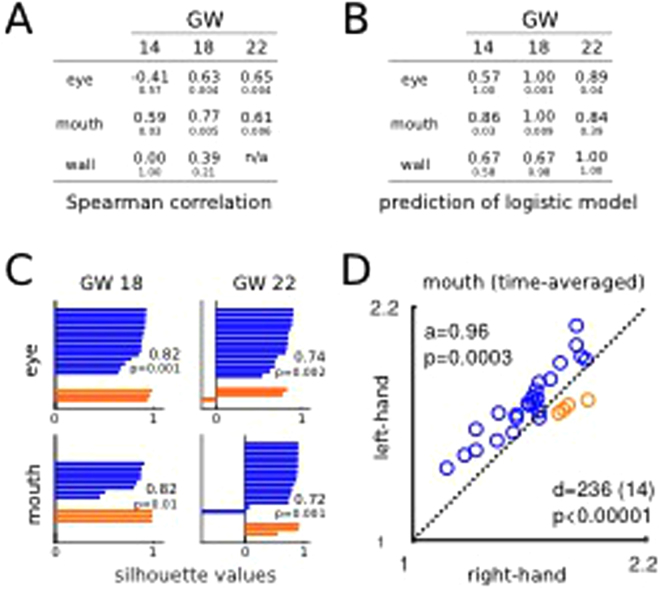
Figure 4.
(A) Spearman’s correlation of the HAA with handedness (upper values), and respective p-values (lower values). (B) Prediction accuracy of the logistic regressions combined with Leave-One-Out-Cross-Validation (upper values), and associated p-values (lower values). (C) Silhouette indices and relative p-values for the eye and mouth movements at GW 18 and 22. (D) Mouth MT averaged over GWs. Accuracy (a) and correlation (c) provided along with p-values.

