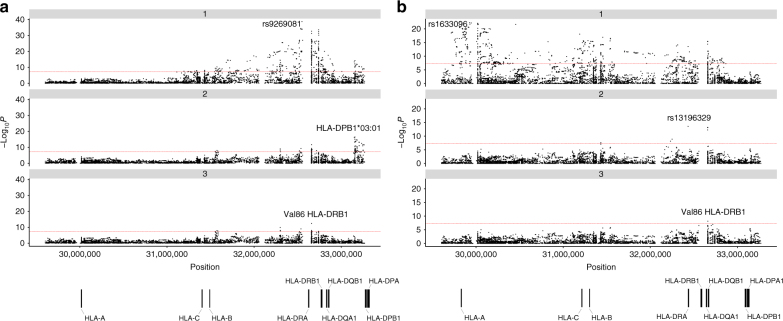
Fig. 3.
Manhattan plot representation of the step-wise conditional logistic regression of risk of a nodular sclerosis Hodgkin lymphoma and b mixed cellularity Hodgkin lymphoma within the human leukocyte antigen (HLA) region. (a1) Unconditioned test of the HLA region. (a2) Results of the HLA region after conditioning on rs9269081. (a3) Results of the HLA region after conditioning on rs9269081 and HLA-DPB1*03:01. (b1) Unconditioned test of the HLA region. (b2) Results of the HLA region after conditioning on rs1633096. (b3) Results of the HLA region after conditioning on rs1633096 and rs13196329. Physical positions are based on NCBI build 36 of the human genome. The −log10 of the combined logistic regression test P-values are plotted against their physical chromosomal position. The broken red line represents the genome-wide level of significance (P < 5 × 10⁻⁸)

